Prerequisites
Before starting this tutorial, ensure you have the StrucTool app installed on your device. Make sure to review the user guide for an overview of StrucTool's features and capabilities.
Step 0 — Tips for Accuracy
As my grandpa used to say, a tool is only as good as the tool using it. StrucTool is a powerful and user-friendly app, but it won't replace good geological sense and field practices. Here are a few tips to ensure you get the most accurate and reliable data when using StrucTool in the field:
- Your device's magnetometer is much more precise that your old pocket transit. That precision comes from the sensitivity of the magnetometer. As a result, it is much more sensitive to magnetic interference. Be sure that magnetic materials (including watches!) are kept away from the device during measurements. Many phone cases and accessories now come with embedded magnets! It is recommend that you use a simple, rubber case to minimize interference.
- Unlike a pocket transit, your device has the ability to recalibrate the magnetometer and accelerometers on the fly. The current status of the calibration accuracy is displayed in the app and captured with every measurement. Tapping the calibration status will guide you through the recalibration process if accuracy begins to degrade.
- Android location services uses your current GPS coordinate and the most recent version of the NOAA World Magnetic Model (WMM) to calculate true north from magnetic declination. If the WMM is outdated due to natural magnetic drift, or your project's standardized magnetic declination deviates from the WMM, there will be some variance between the bearings captured by this app and those captured by other methods.
- As your device geometry is used as a proxy for the orientation of the structure, ensure that the device attitude accurately reflects the structure attitude. Physical variations in devices like camera bumps, cases or other deviations from a flat plane can affect the accuracy of the measurements.
- Modern MEMS accelerometers and magnetometers offer high precision...typically better than 1 degree. However, this precision is contingent on the proper calibration and usage of an undamaged device. For a small fee to cover shipping, G Industries can provide a simple 3D printed check stand and recommend a testing procedure to ensure that the device measurements are accurate.
Step 1 — Home Screen
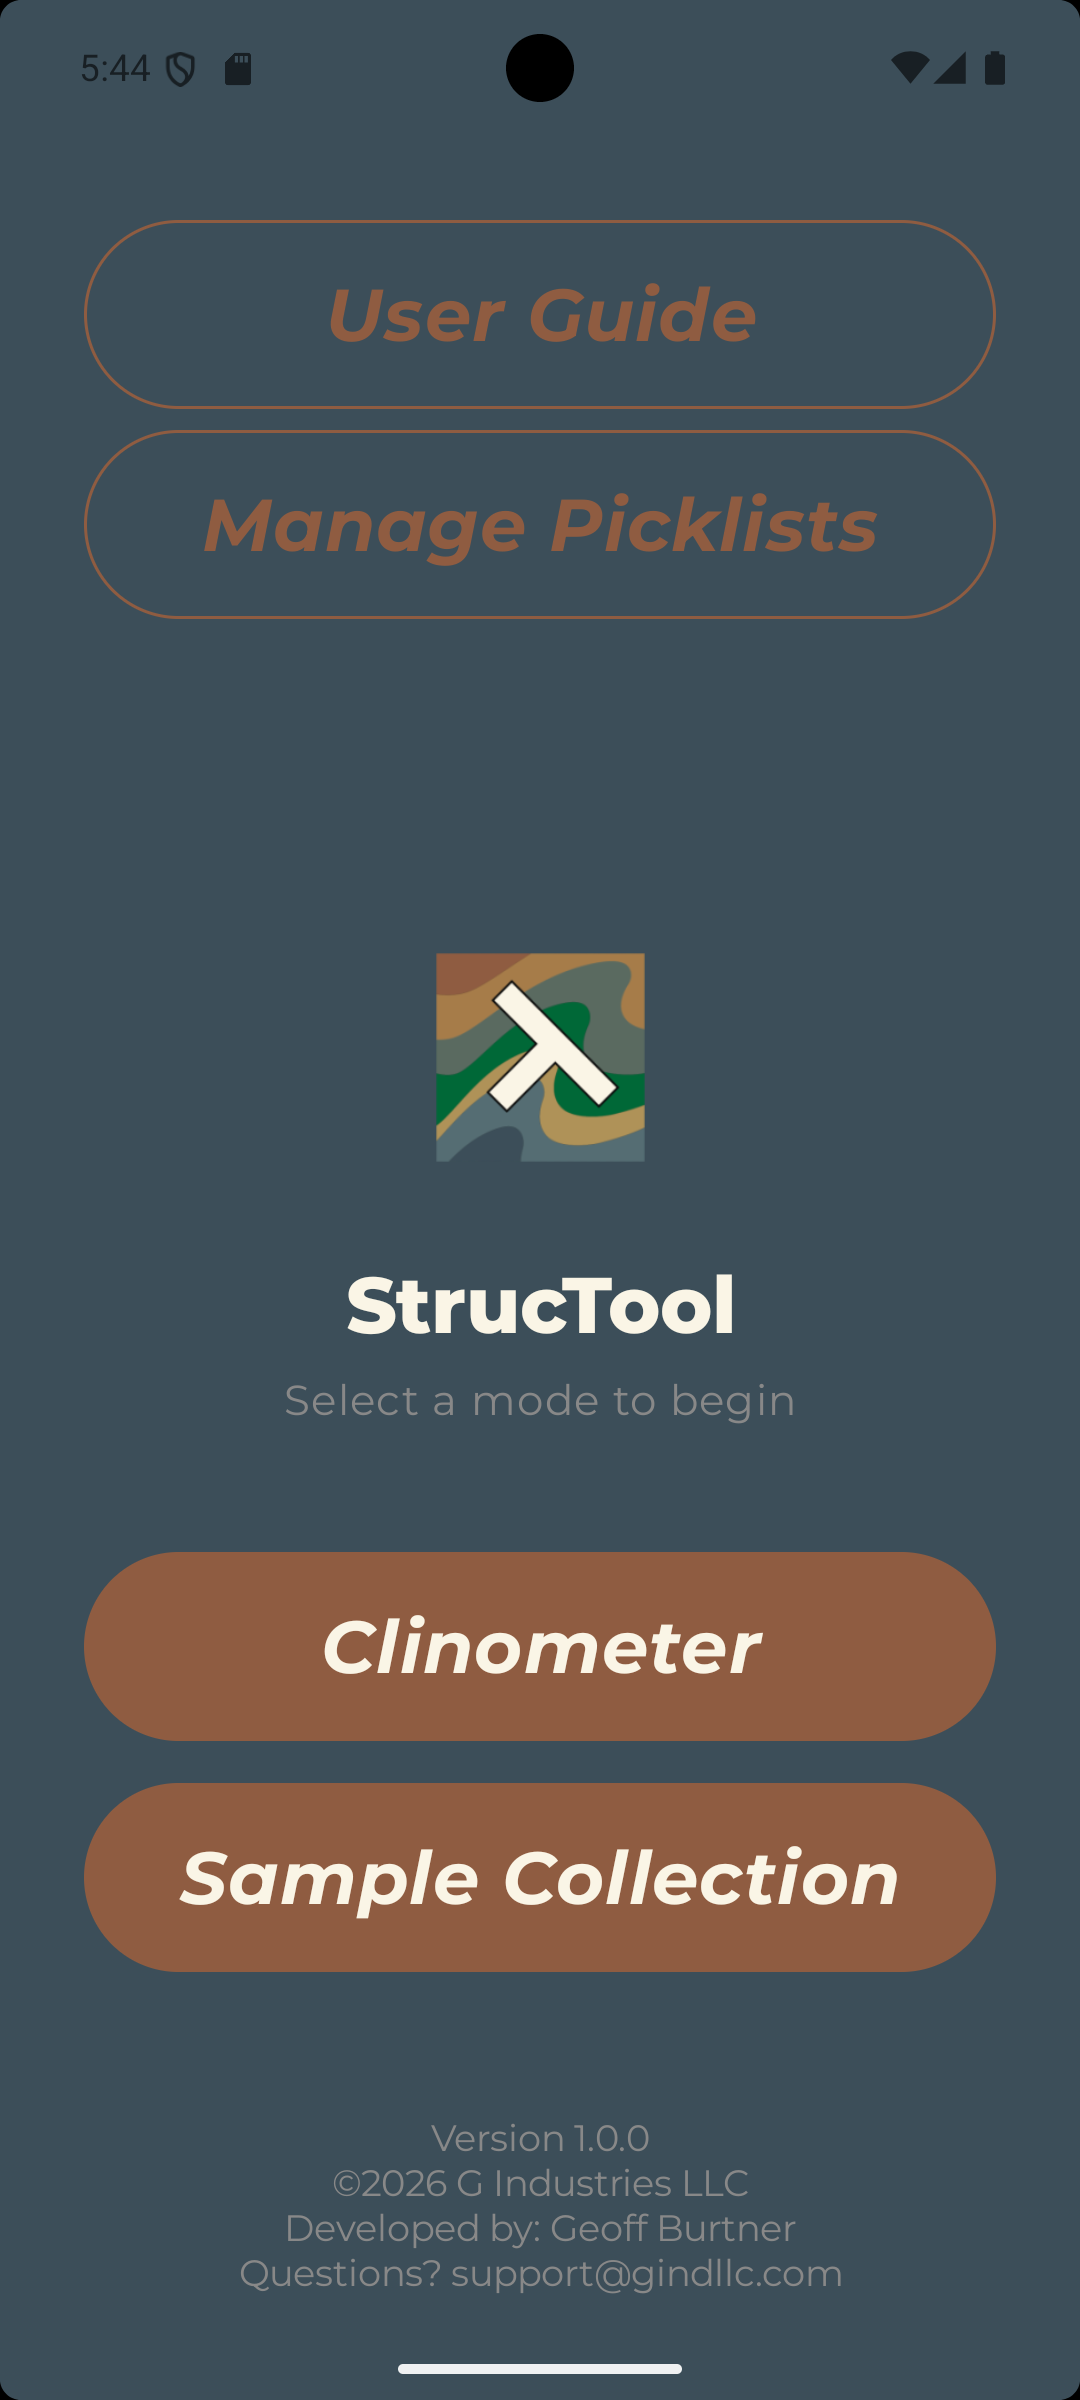
Open the StrucTool app to access the home screen.
From here, you can manage picklists, create new projects and access existing ones.
A basic user guide is also available within the app to help you get familiar with the interface and features. Take a moment to explore the home screen and locate the user guide before proceeding to the next steps.
The first step in using StrucTool is to create and manage your picklists. Picklists are reusable dropdown lists that allow you to standardize data entry across your projects. You can create picklists for lithology, structure type, sample type, or any other categorical data you want to capture consistently. Tap "Manage Picklists" to create and edit your picklists. Once you have your picklists set up, you can easily assign them to your projects and use them to populate dropdown fields during data collection.
When you are ready to begin collecing data, tap either "Clinometer" to begin taking structural measurements, or "Sample Collection" to begin taking samples.
Step 2 — Create Picklists
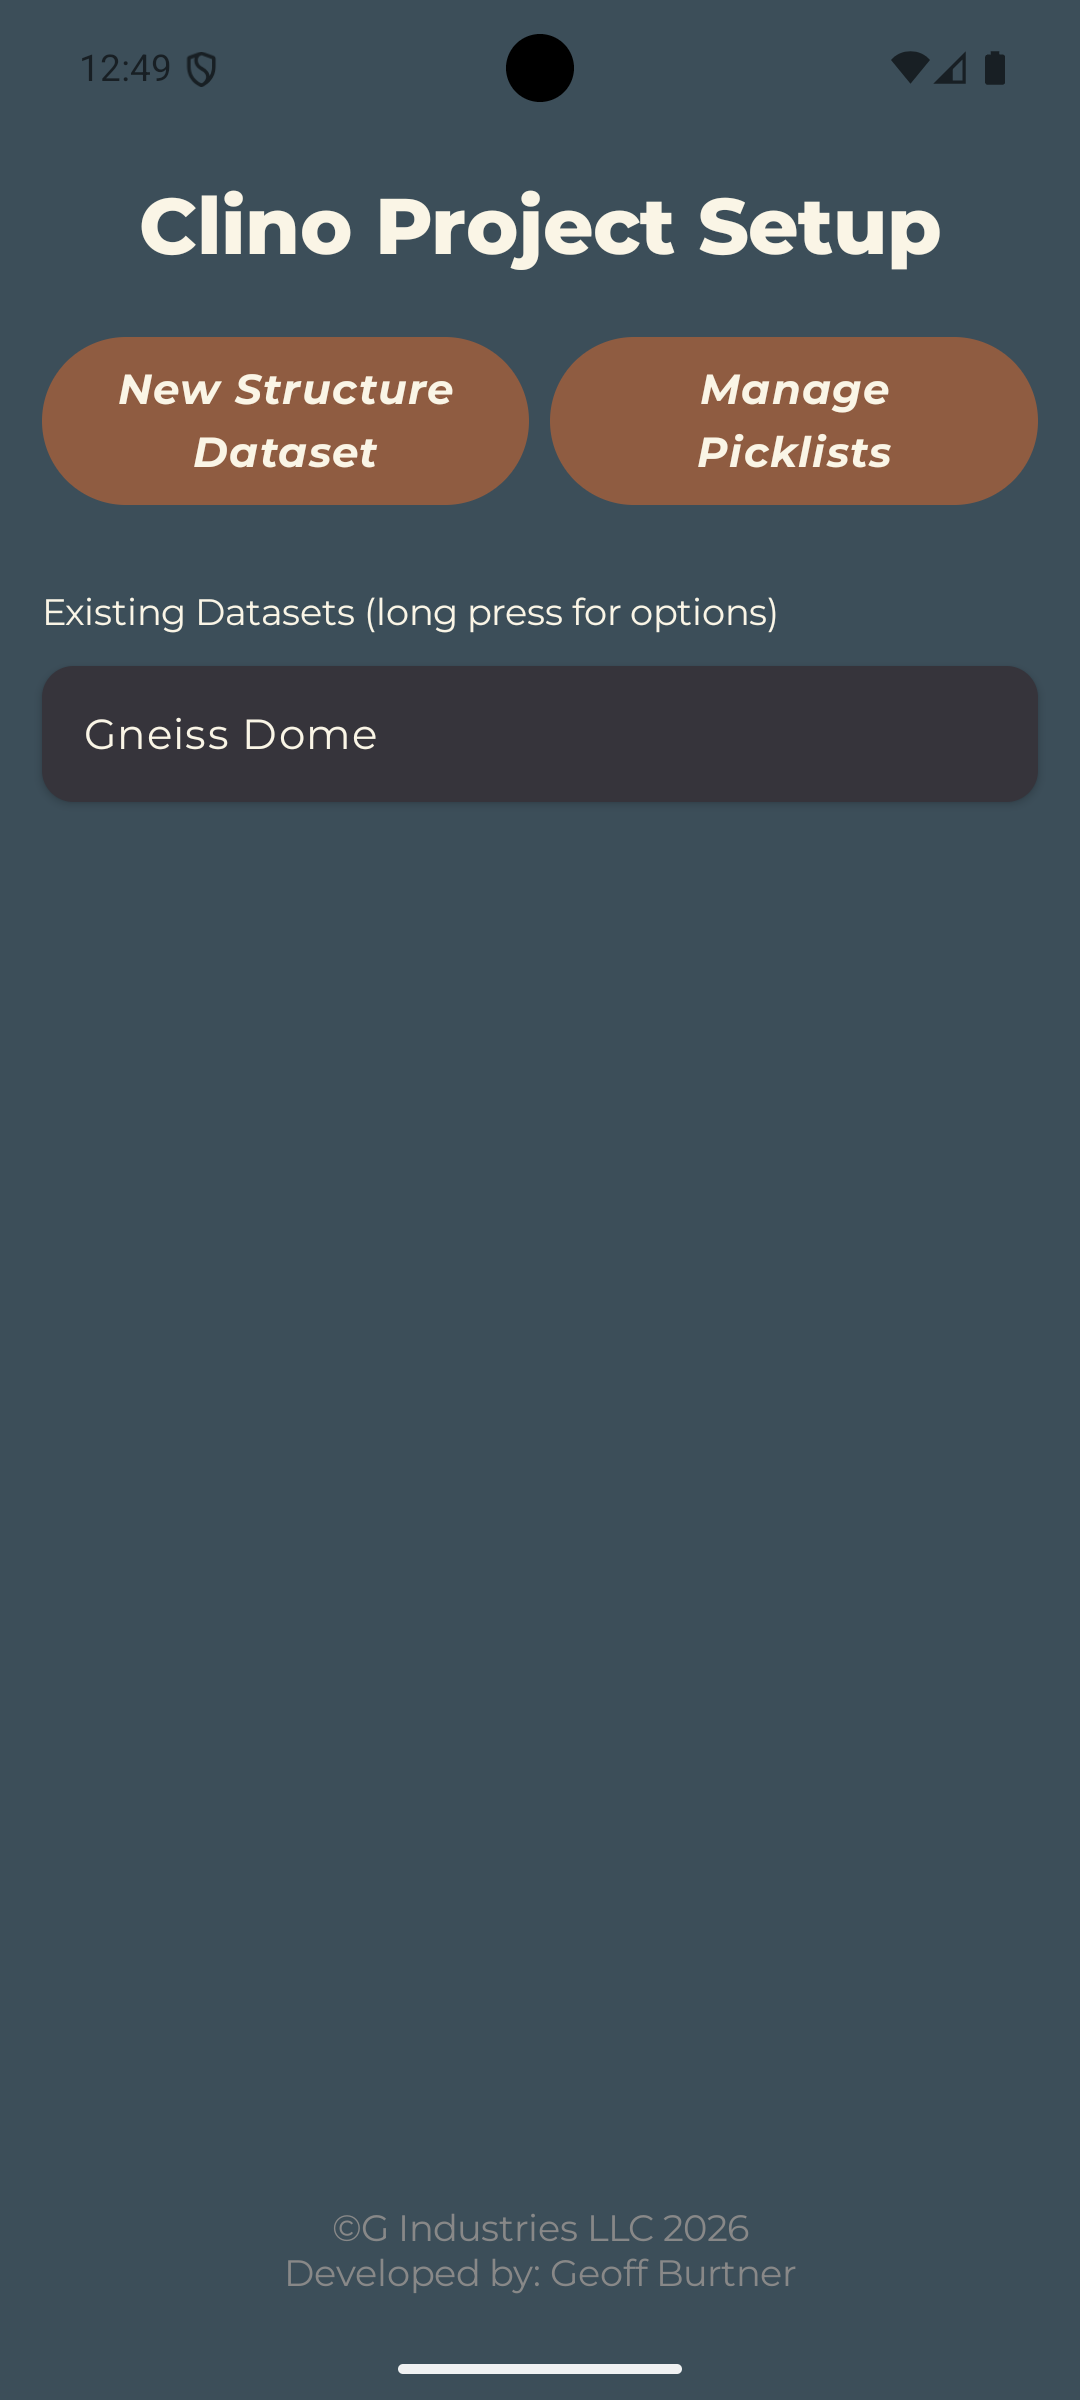
Tapping on either "Clinometer" or "Sample Collection" will take you to Project Setup screens. At the top left of each screen is the "Manage Picklists" button, which allows you to customize the dropdown options for various fields in the app. For example, you can create picklists for "Lithology", "Structure Type", "Sample Type", etc. This allows you to standardize your data collection and ensure consistency across your projects. We recommend setting up your picklists before creating your first project, but you can also edit them at any time, even in the middle of a project. Picklists are shared across all projects, so you only need to set them up once.
The Picklist Manager allows you to setup customized, categorical lists to populate dropdown fields. Lists created here will be available to use across all projects in StrucTool. Existing lists can be edited or deleted at any time by long-pressing the picklist. To create a new picklist, tap the "Create New Picklist" button.
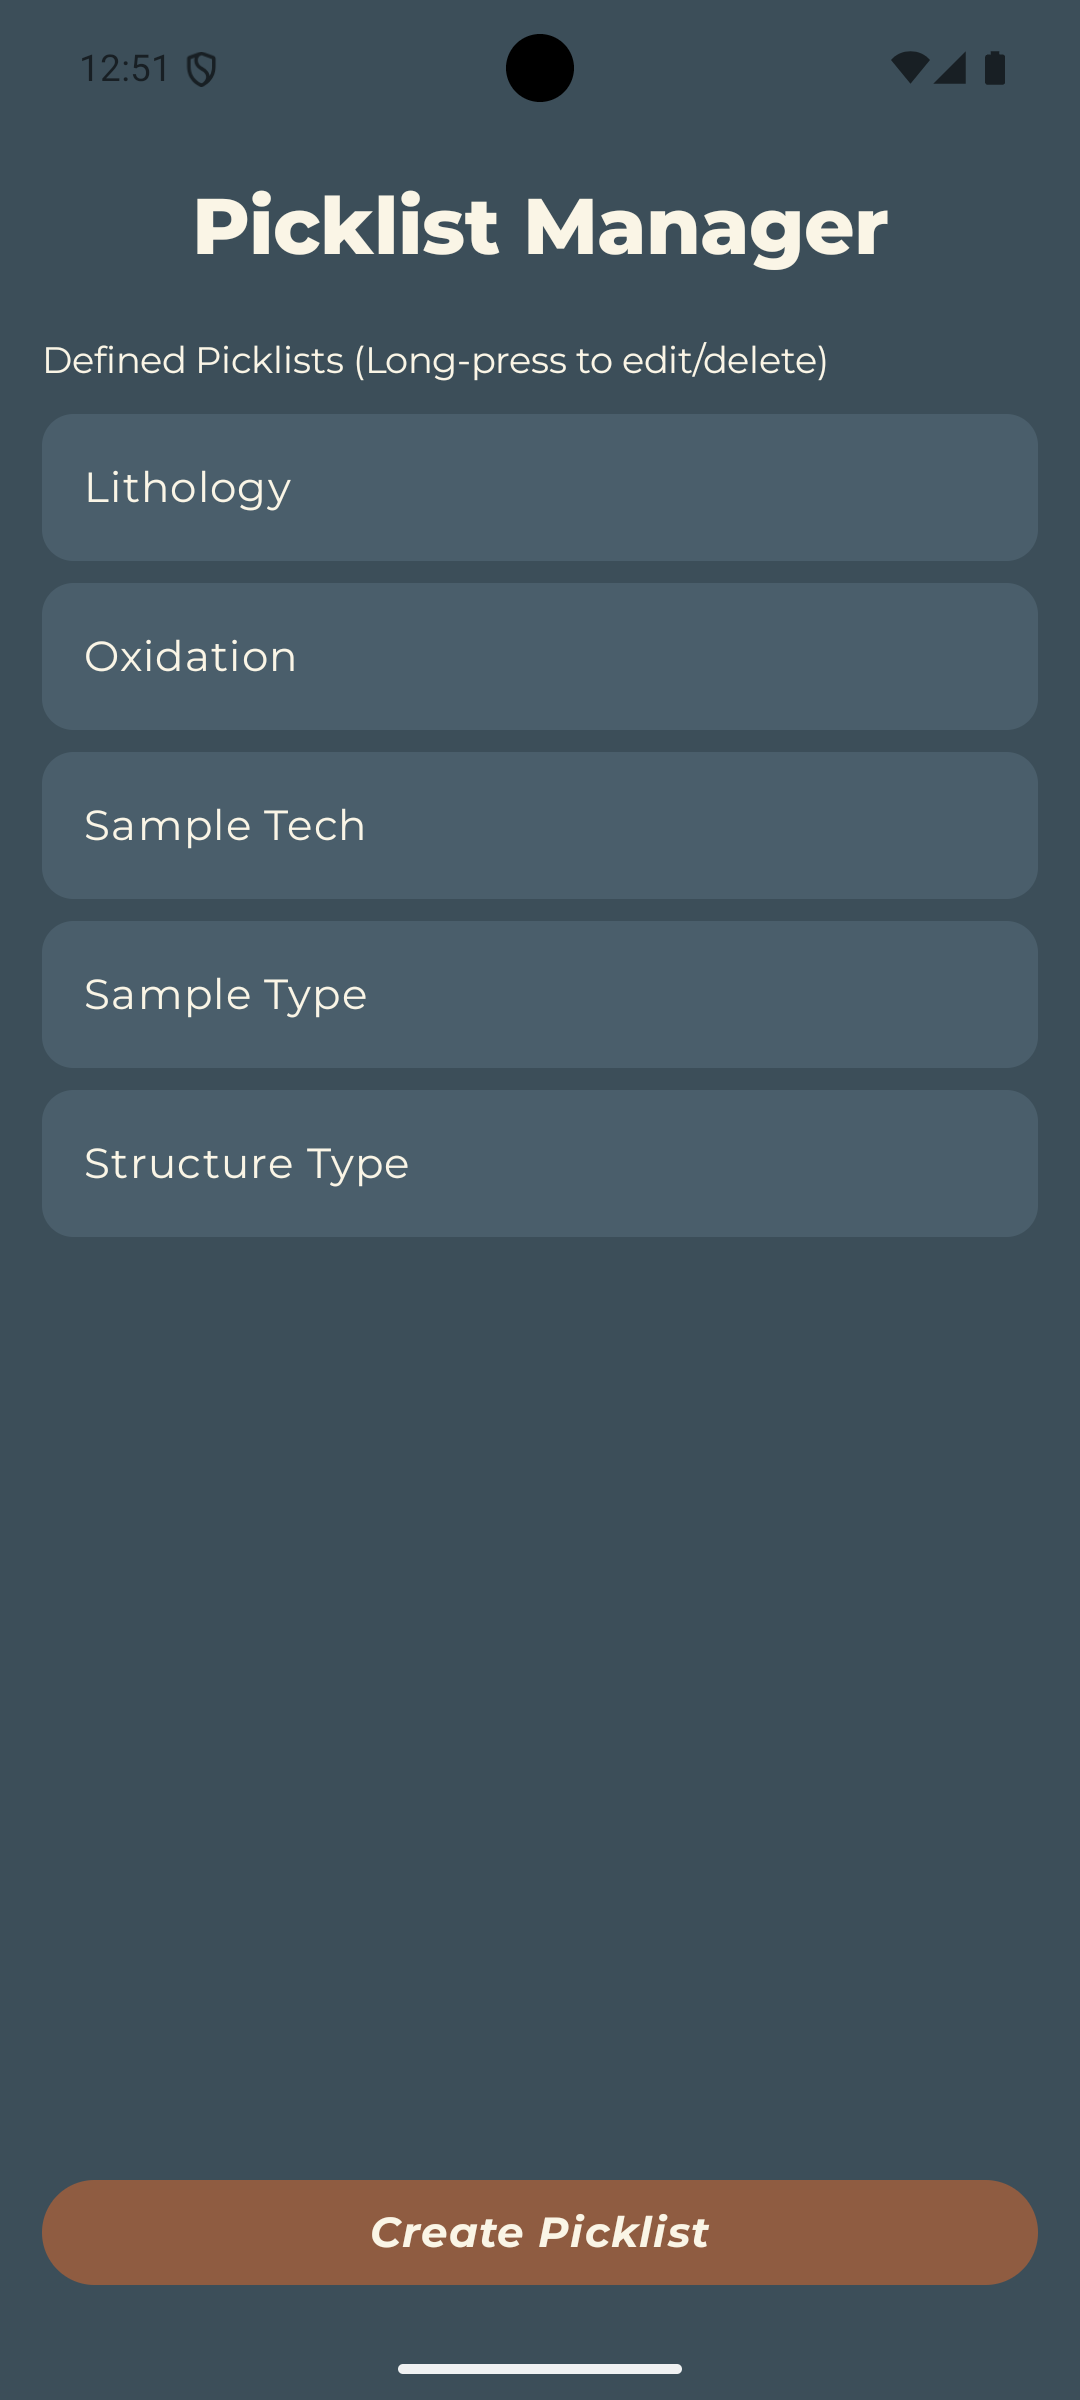
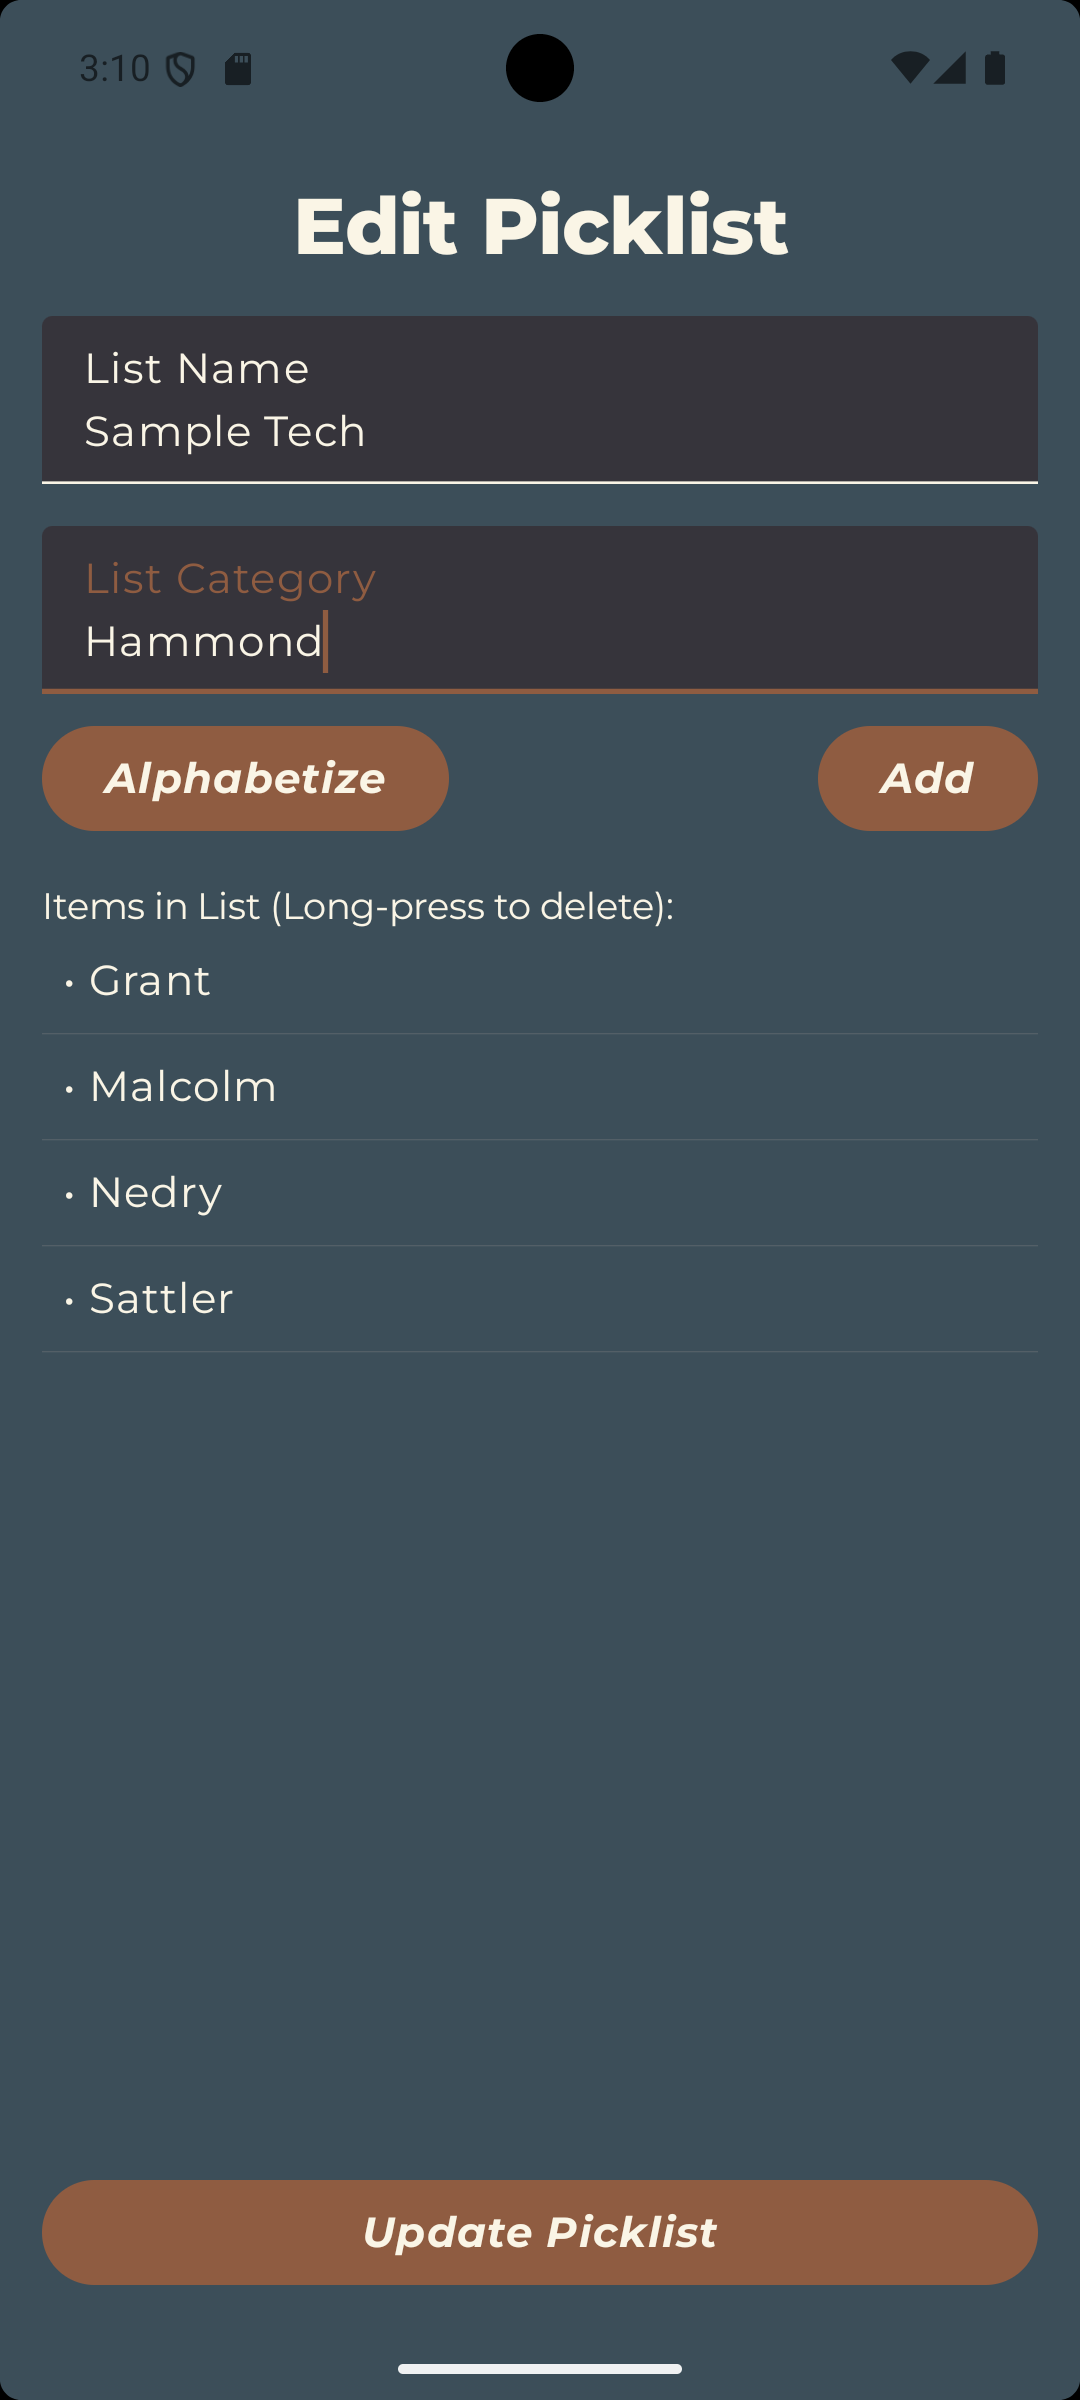
Tapping "Create New Picklist" or selecting "Edit Picklist" from the long-press menu will open the Picklist Editor. Here you can add or remove items from the picklist, and edit the name of the picklist itself. When you are finished making changes, tap "Save Picklist" to save your changes and return to the Picklist Manager. If out-of-order lists drive you crazy, you can also alphabetize your picklist with the "Alphabetize" button. When you are finished, tap "Save Picklist" to create the new list or "Update Picklist" to save changes to an existing list.
To speed up building large lists, the Picklist Editor also supports importing and exporting categories as CSV files. Tap "Import CSV" while creating or editing a picklist and select a file to add every value it contains to the current list; categories that already exist are skipped, and a message reports how many new categories were imported. Because imported items are appended to whatever is already in the list, you can combine a CSV with manually entered items. To share a list, tap "Export CSV" to save the current picklist as a file named "ListName_picklist.csv" — the same format accepted by Import CSV, so an exported list can be re-imported into another picklist.
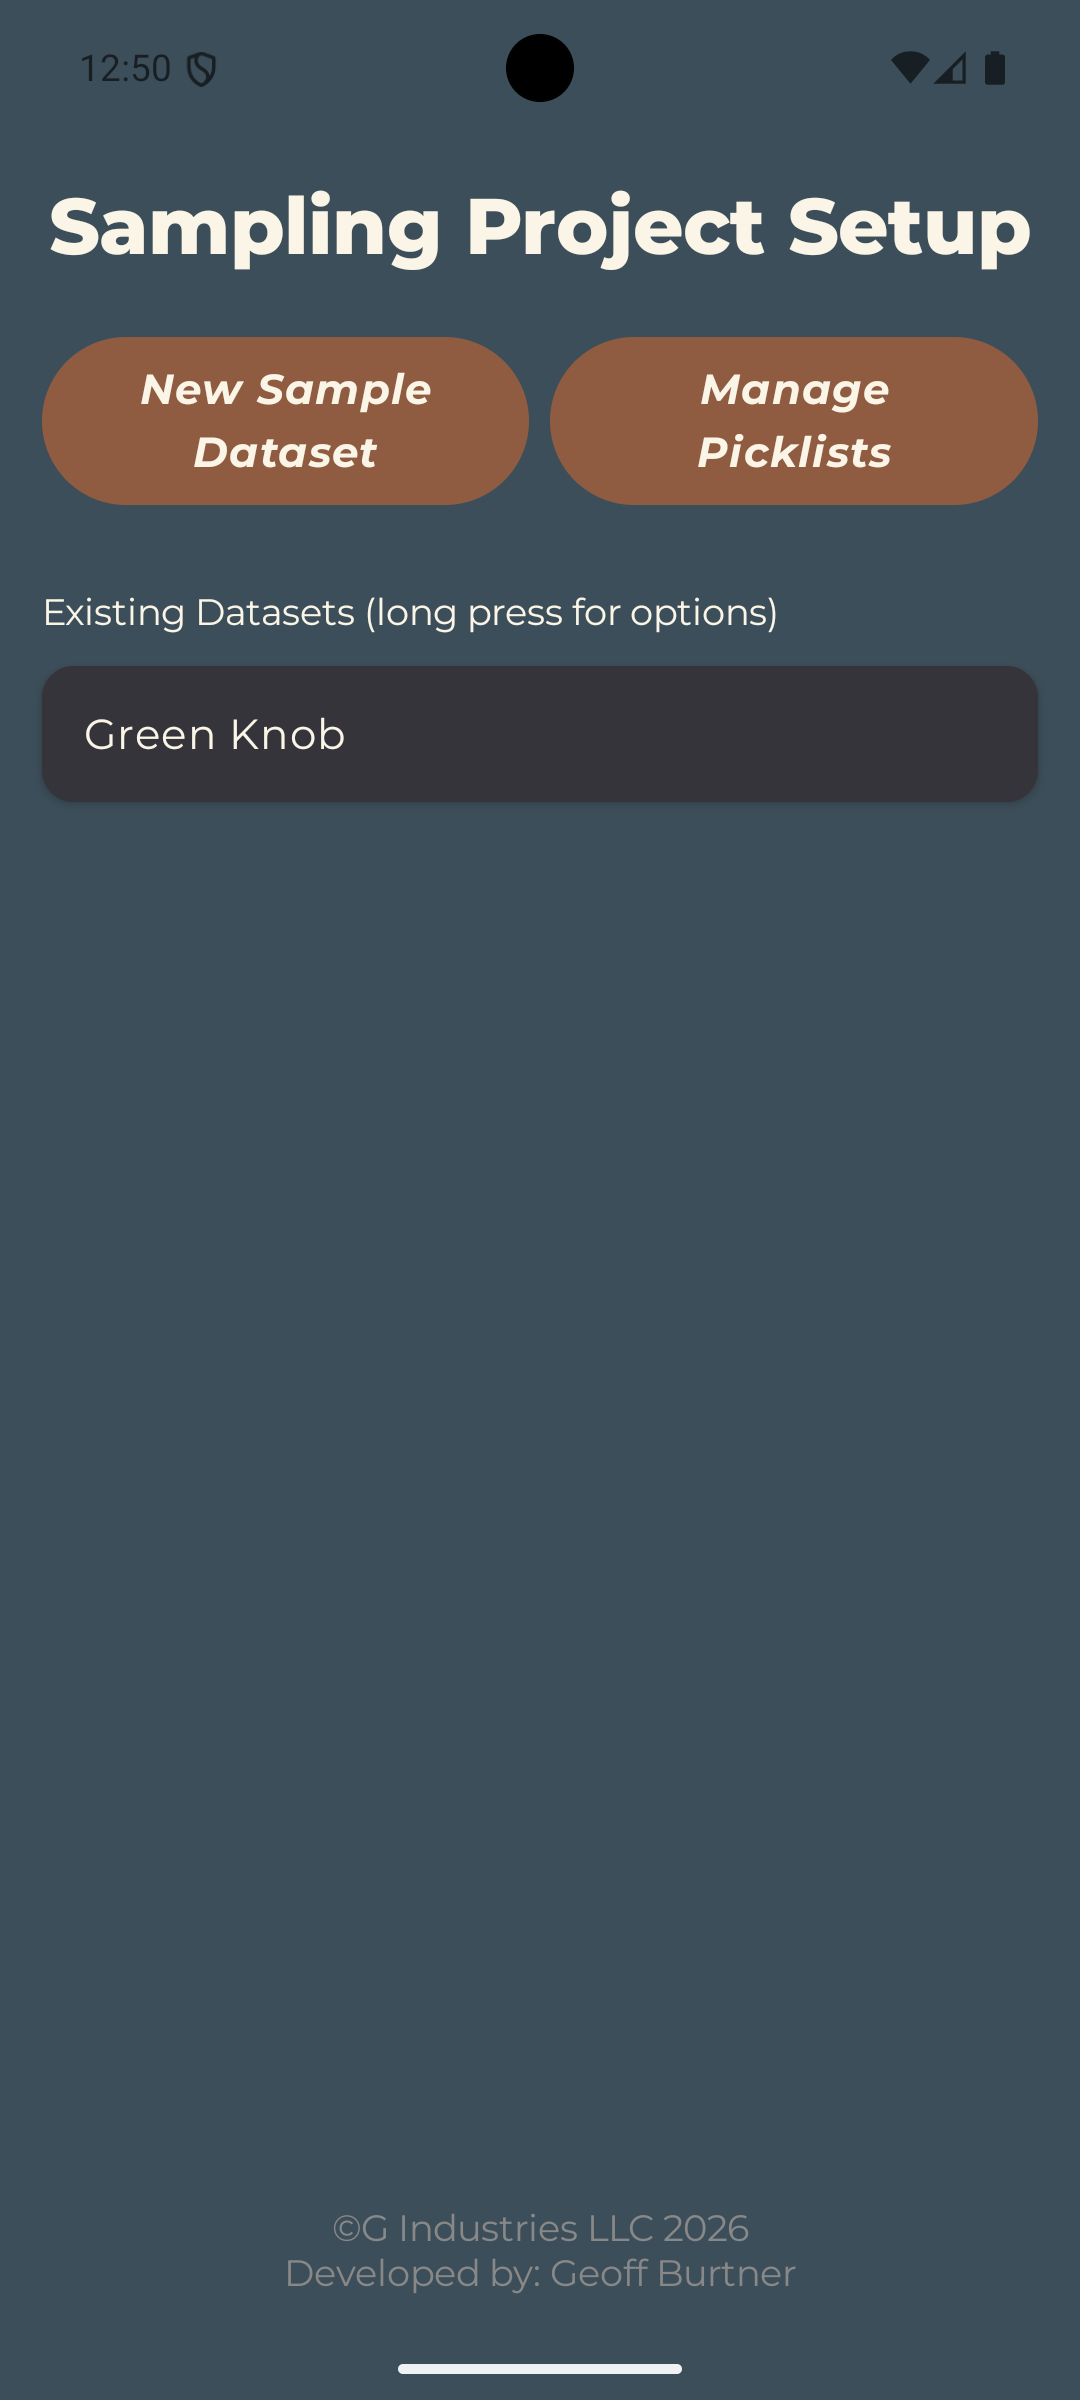
Step 3 — Create New Dataset
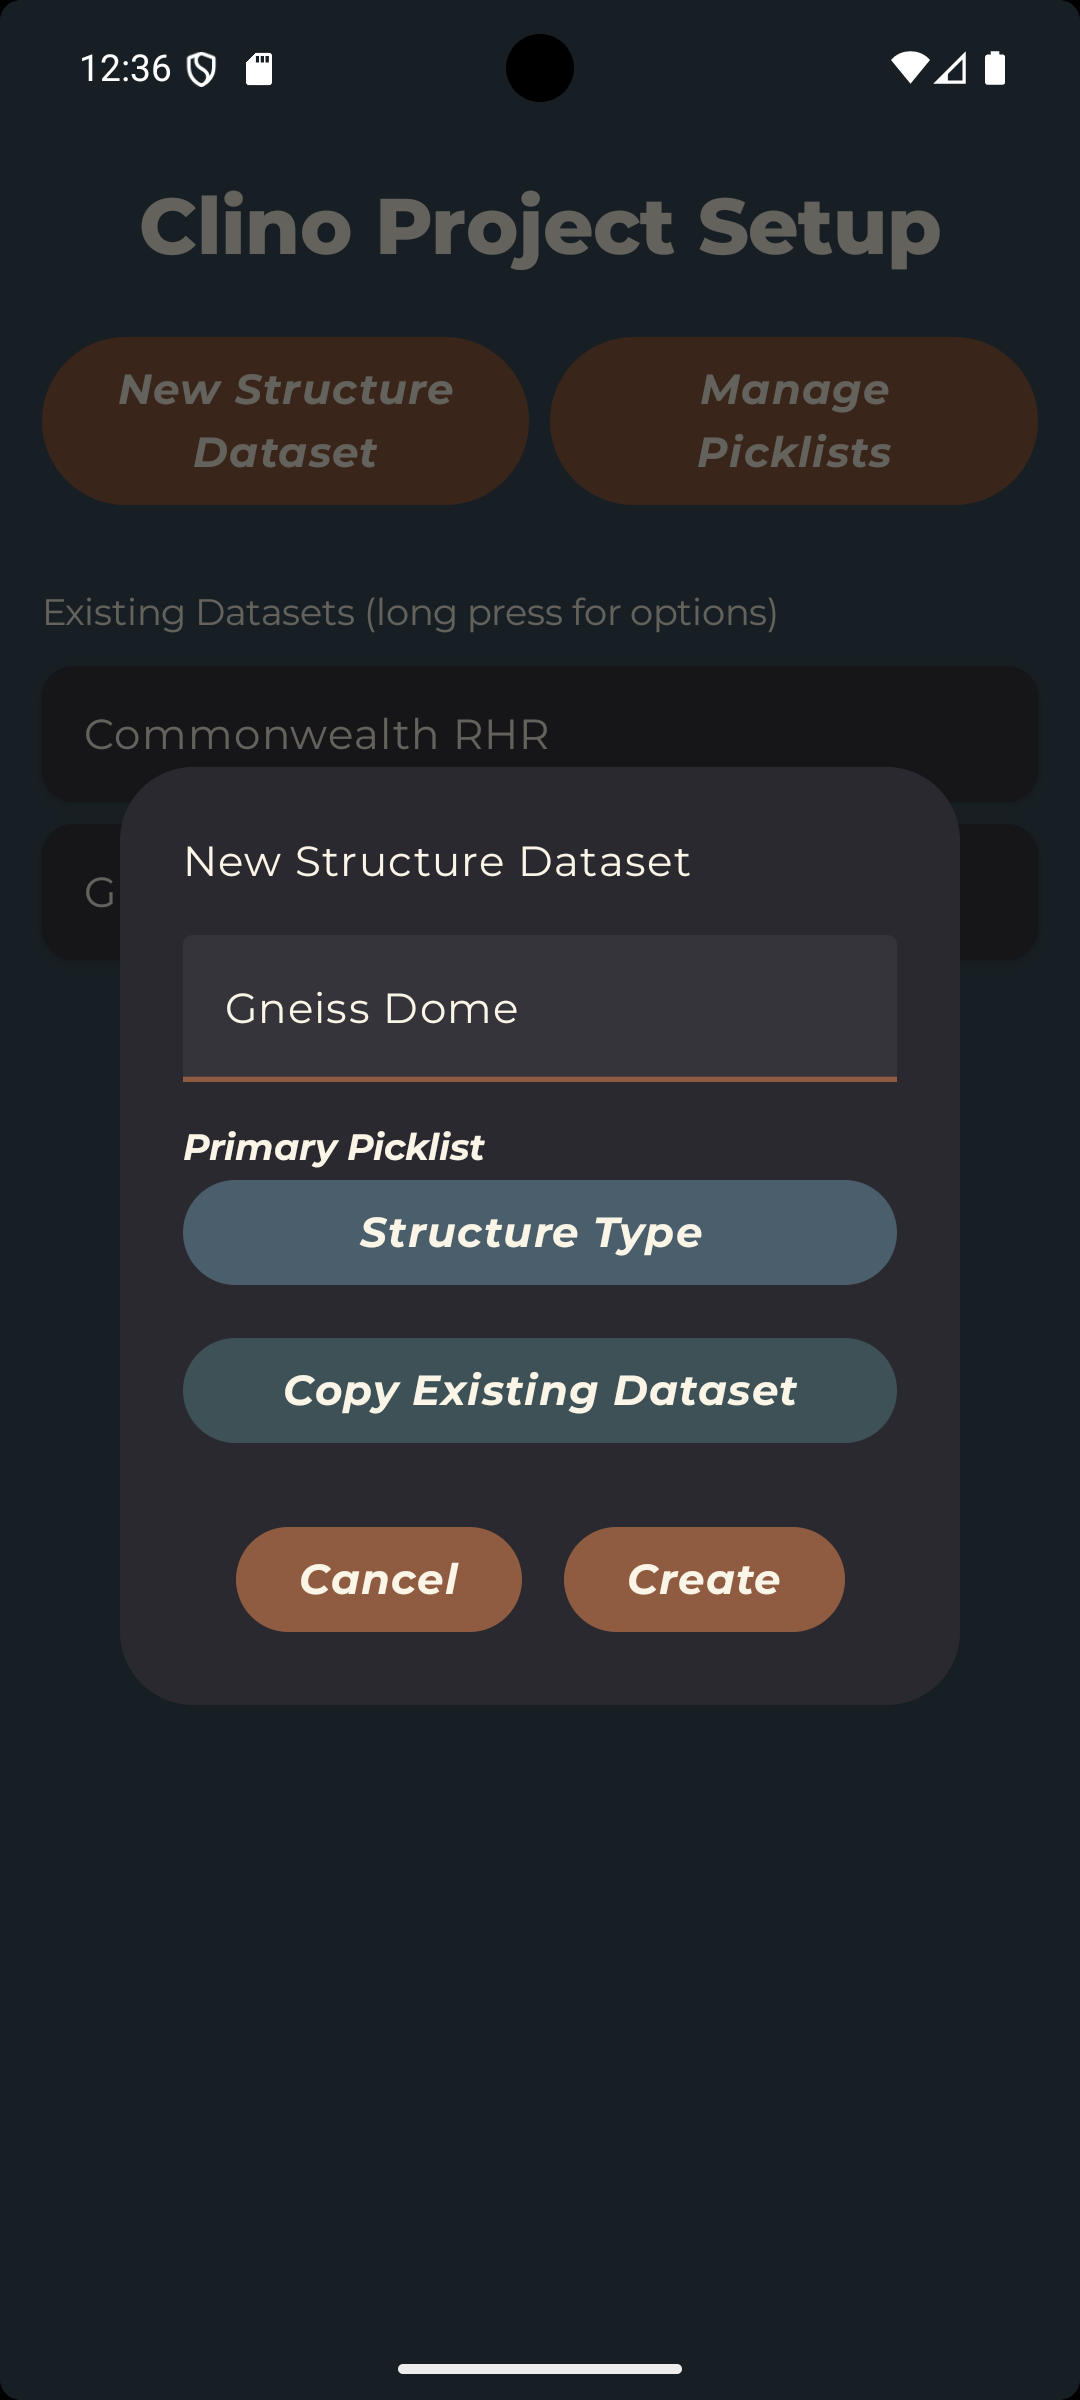
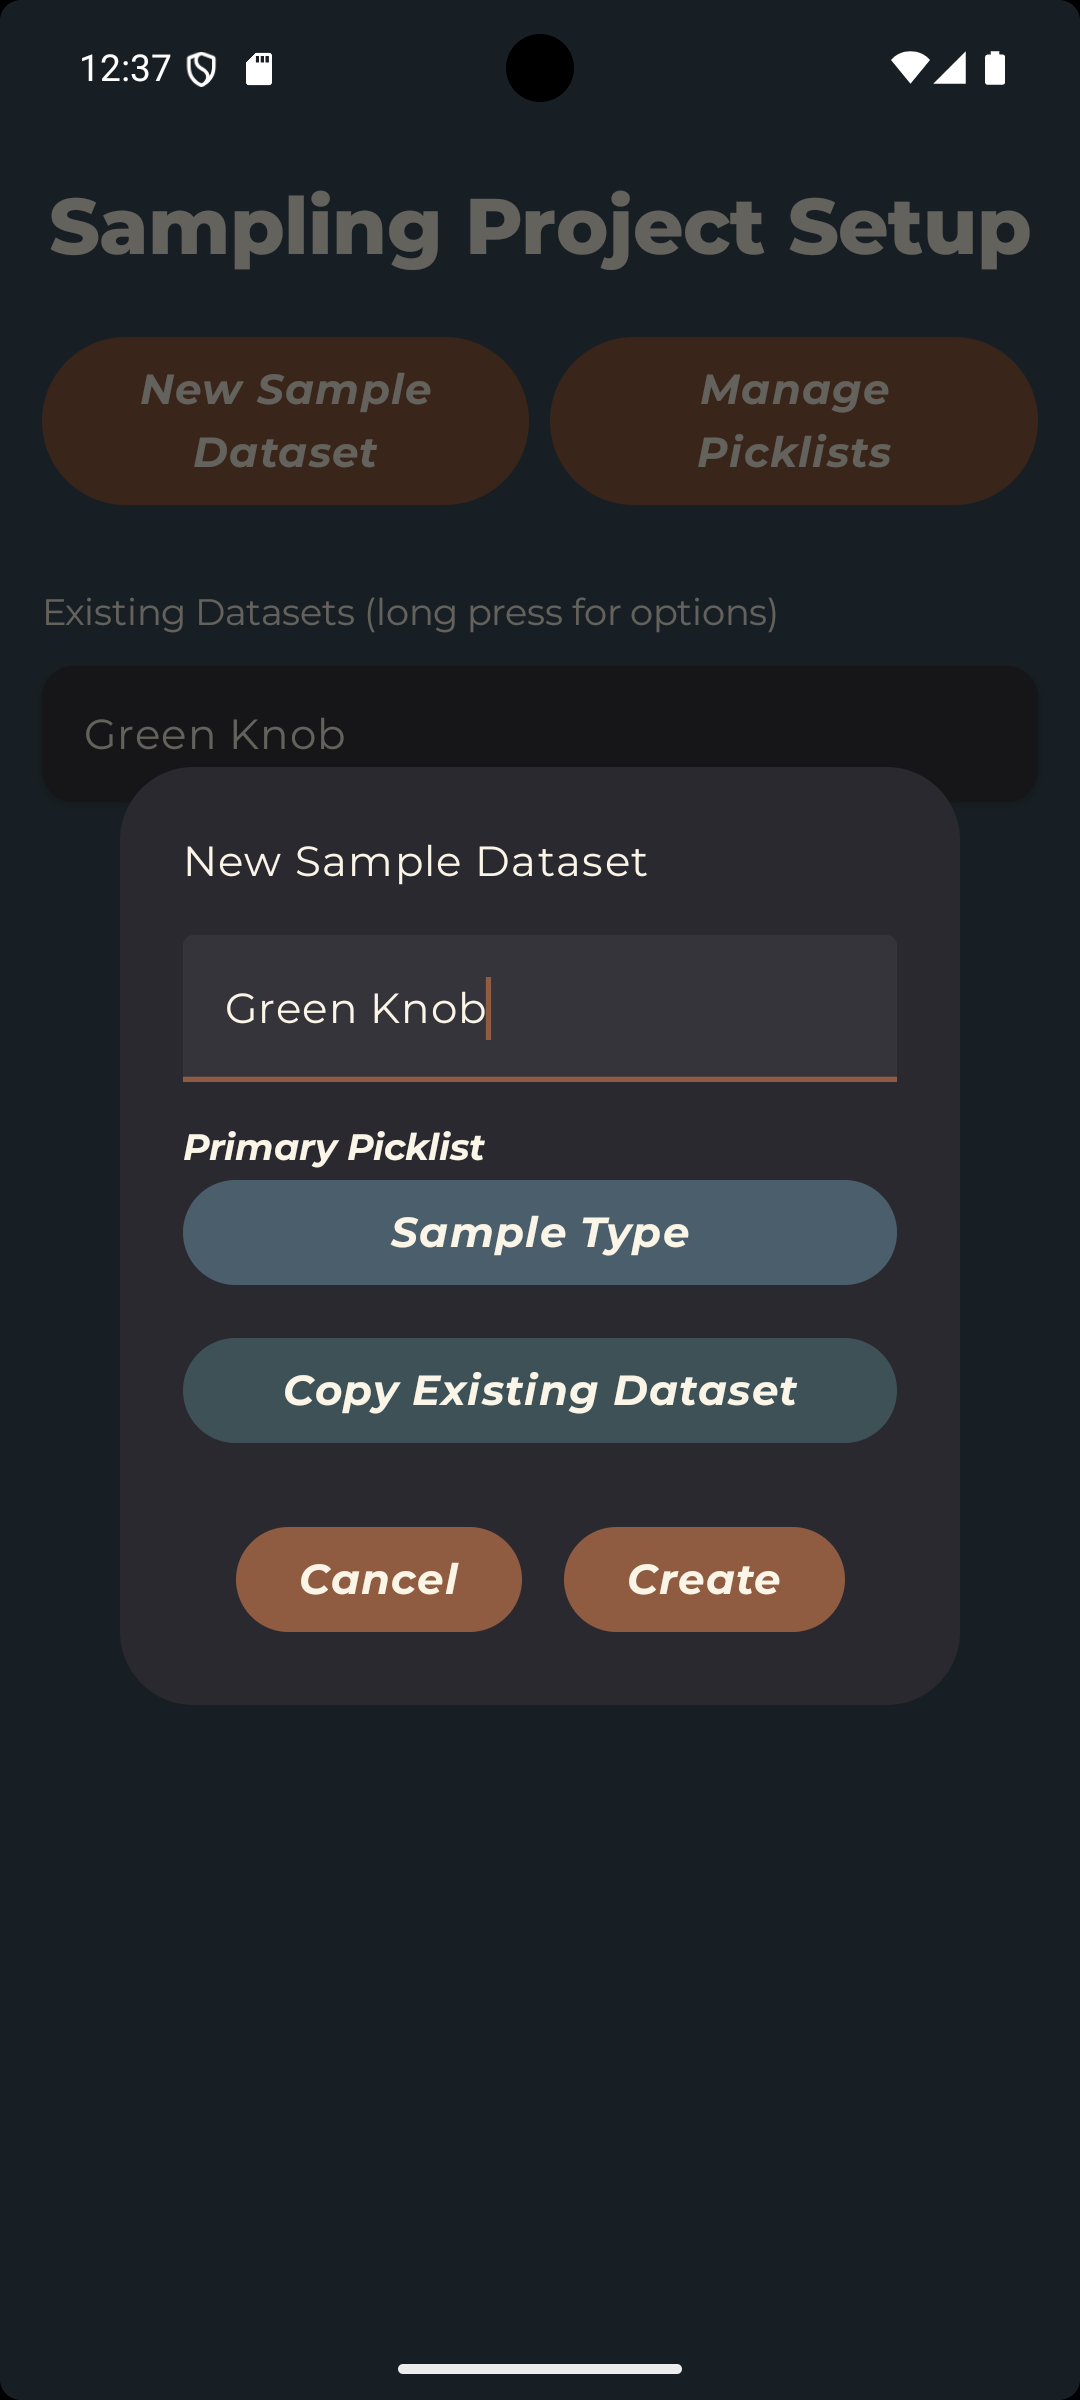
After setting up your picklists, you are ready to create your first dataset and start collecting data. Tapping "Clinometer" or "Sample Collection" on the home screen will take you to the respective project setup screen. To create a new dataset, tap the "New Sample Dataset" or "New Structure Dataset" button at the top of the screen. Enter a name for your project and select a primary picklist for your dropdown fields. The primary picklist will be considered mandatory and every entry in your dataset must have a value for that field. You can also copy the settings from an existing dataset with the "Copy Existing Dataset" button. This will apply all user-definable properties of an existing dataset to the new dataset: coordinate format, primary picklist, strike reporting mode, and user-selected custom fields. When you are finished, tap "Create" to create the dataset and either start collecting data or designate other data fields.
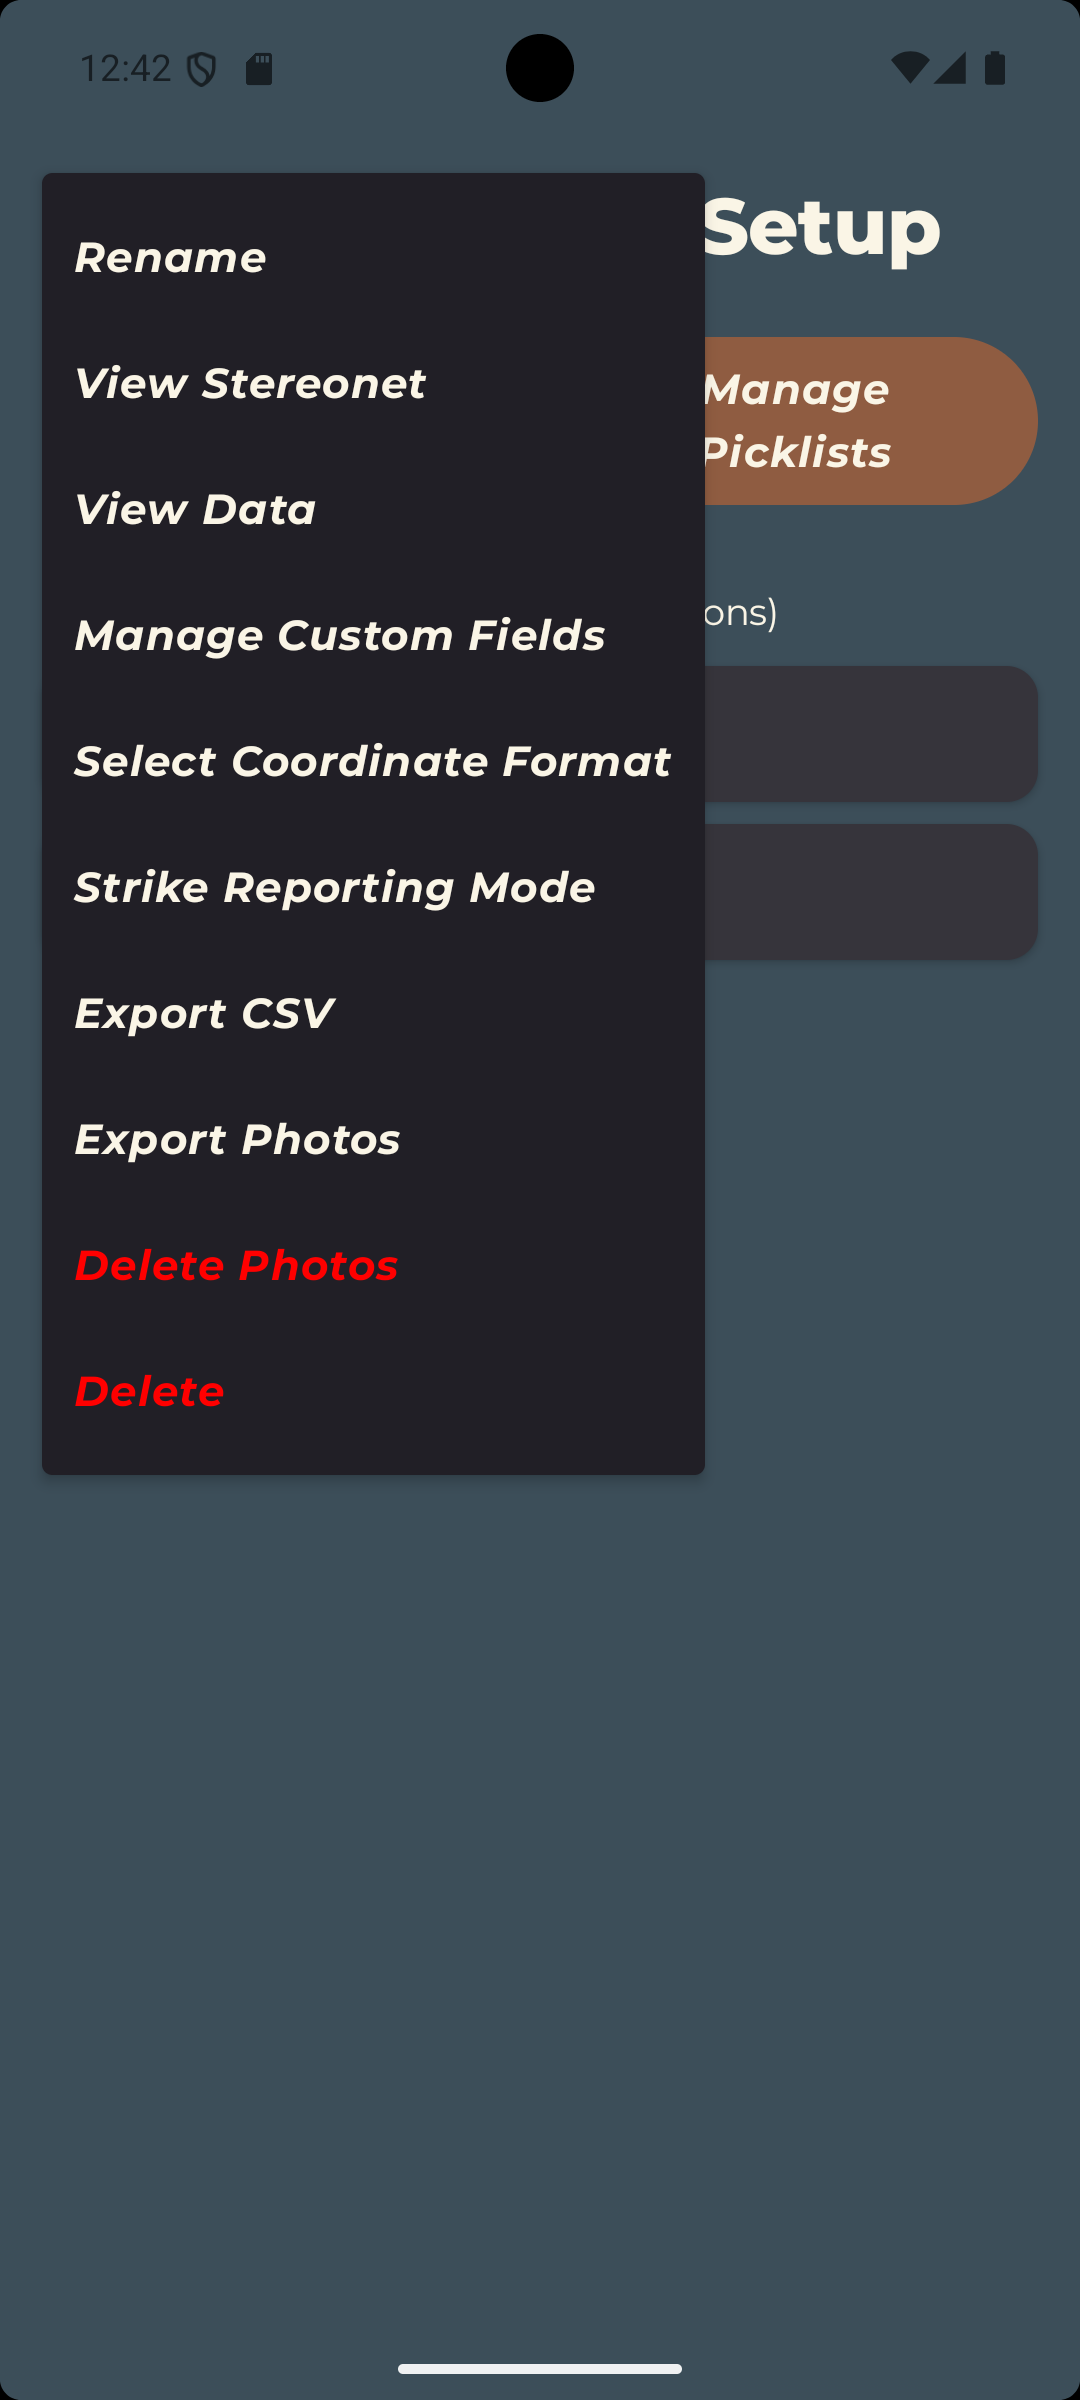
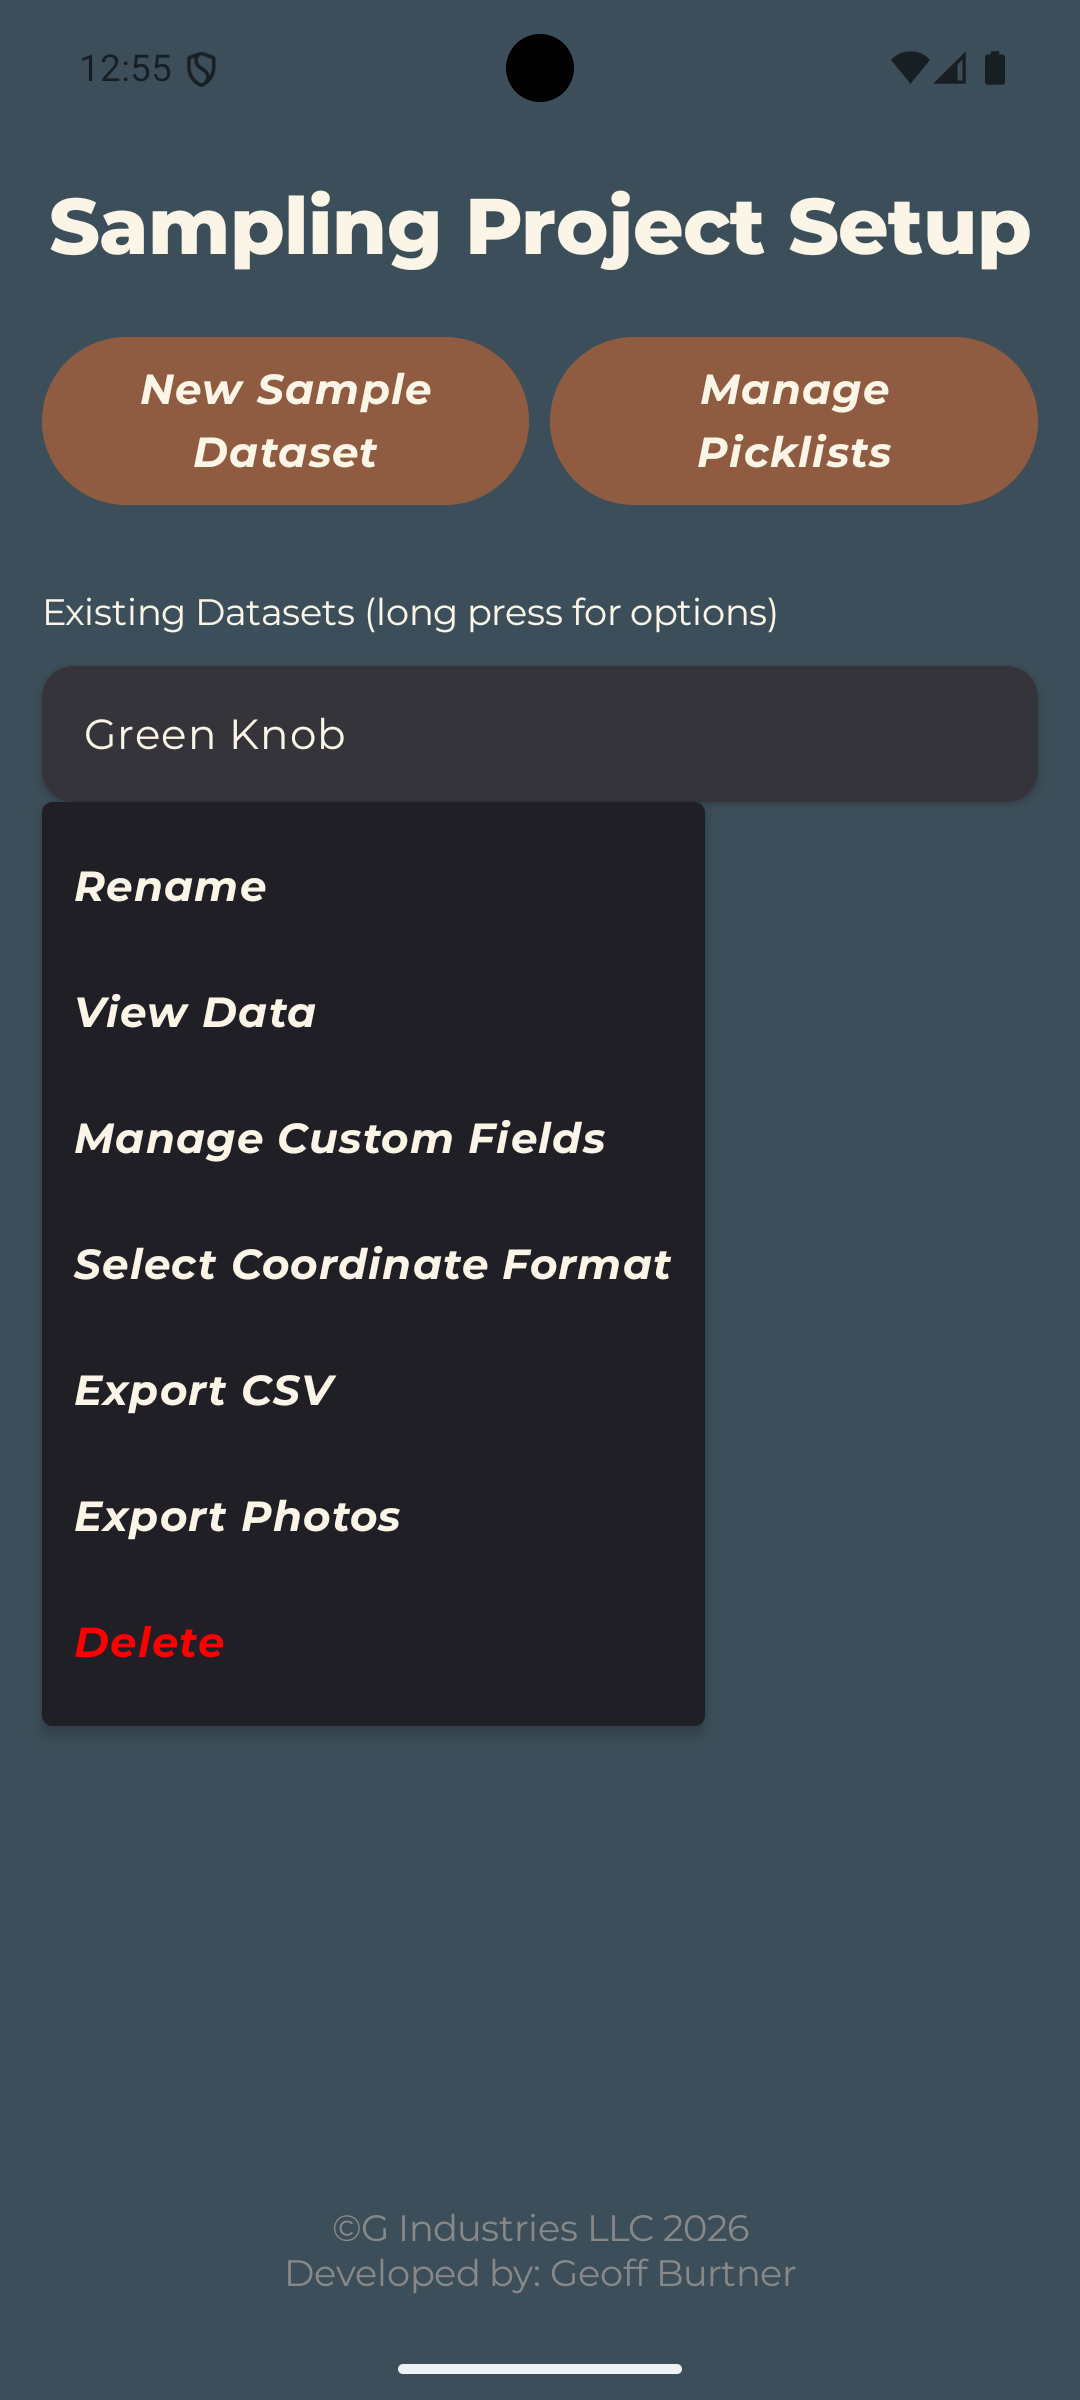
Long-pressing a dataset from the home screen will also give you the option to edit the dataset's name, view existing data, add or remove additional custom fields, change the coordinate format (Datum WGS84 Lat/Lon or UTM), change the strike reporting mode (No Strike, American or Commonwealth RHR) export data, erxport photos or delete the dataset and photos. The most important option here is "Manage Custom Fields" where you can set up any number of additional data fields.
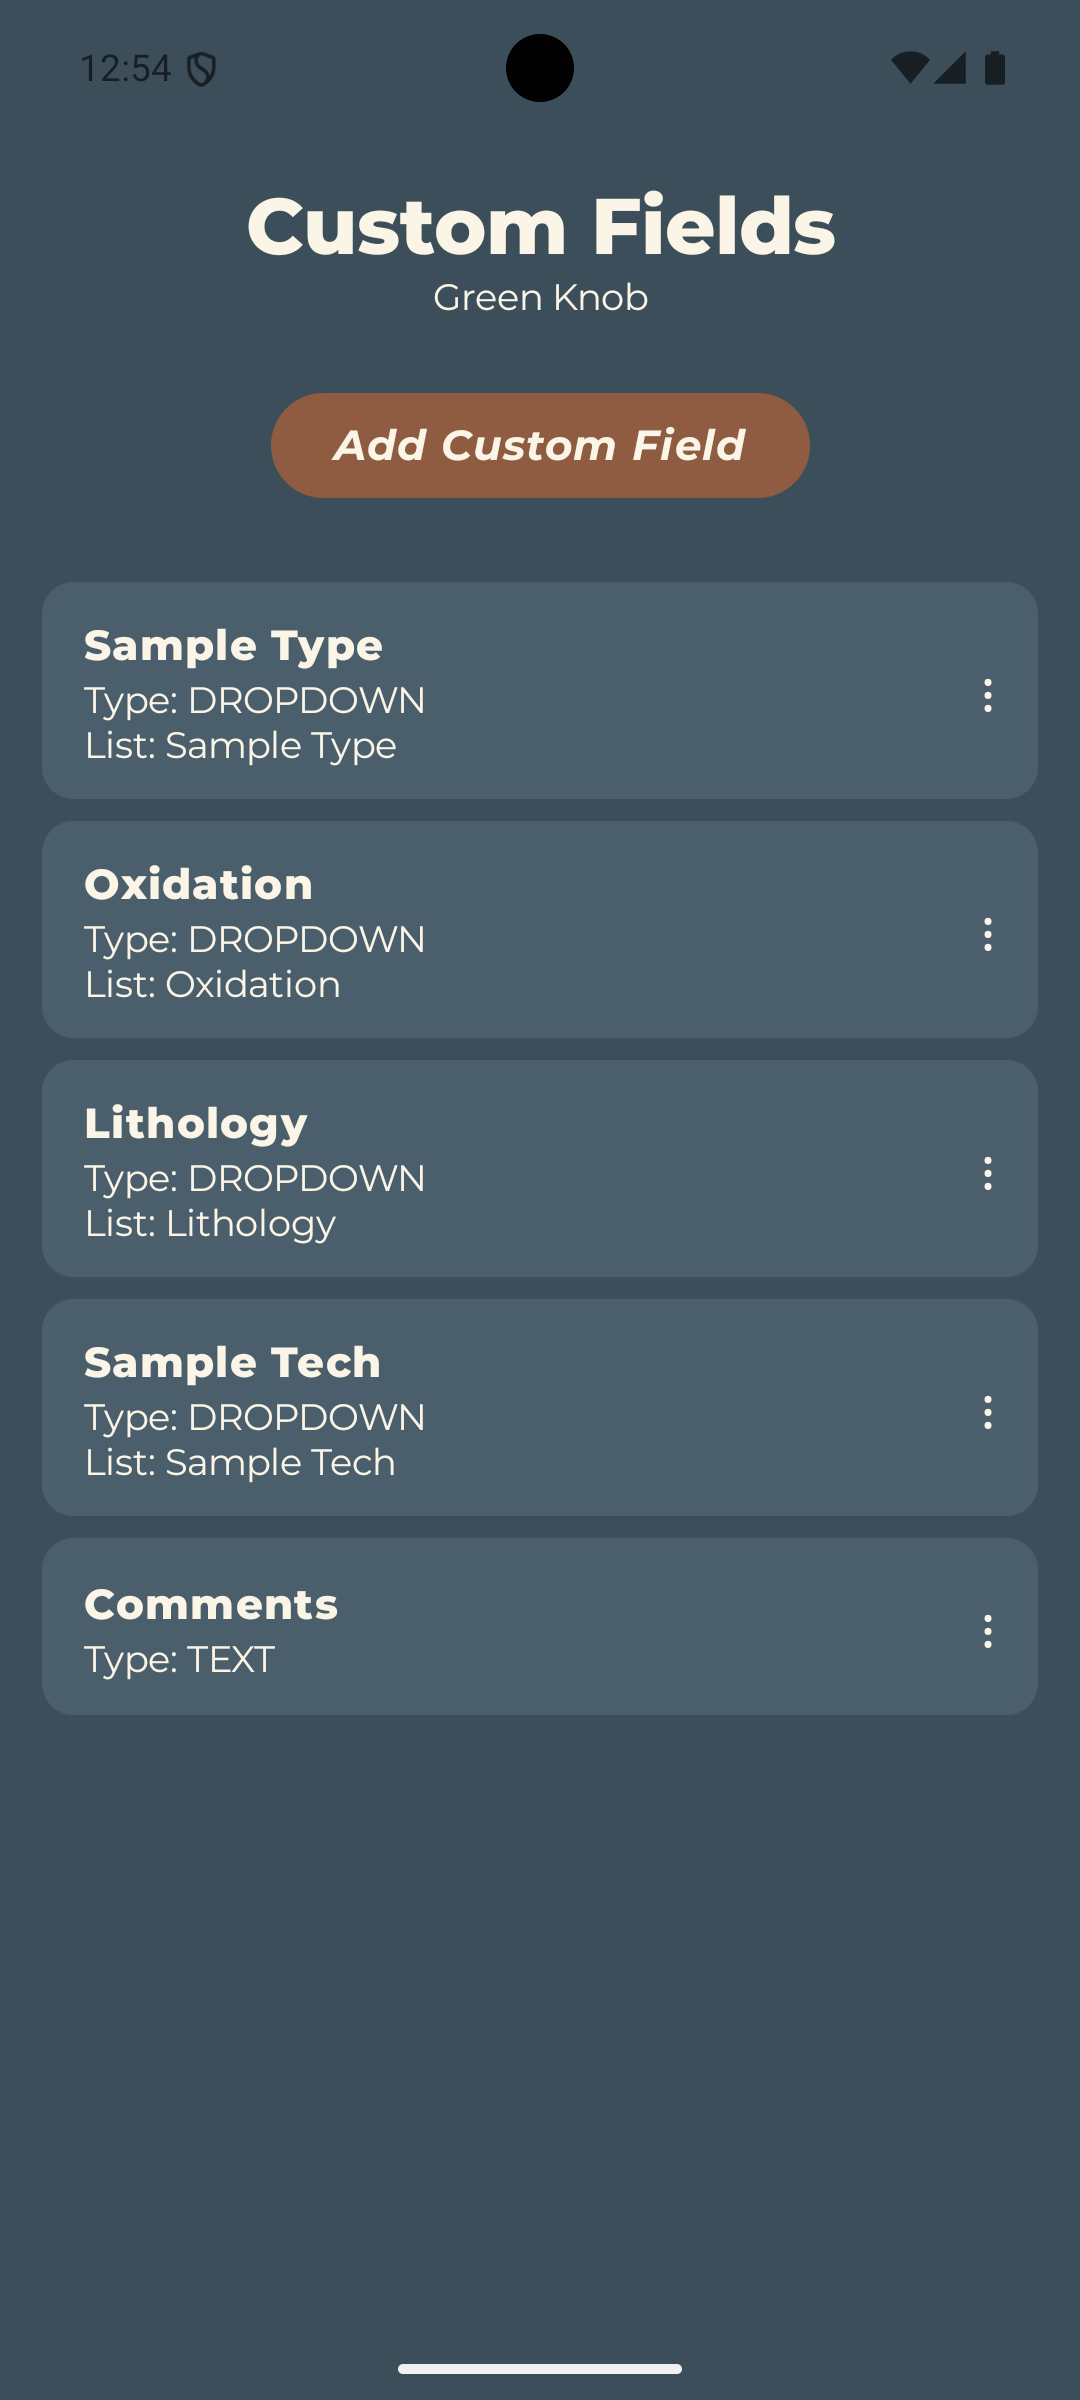
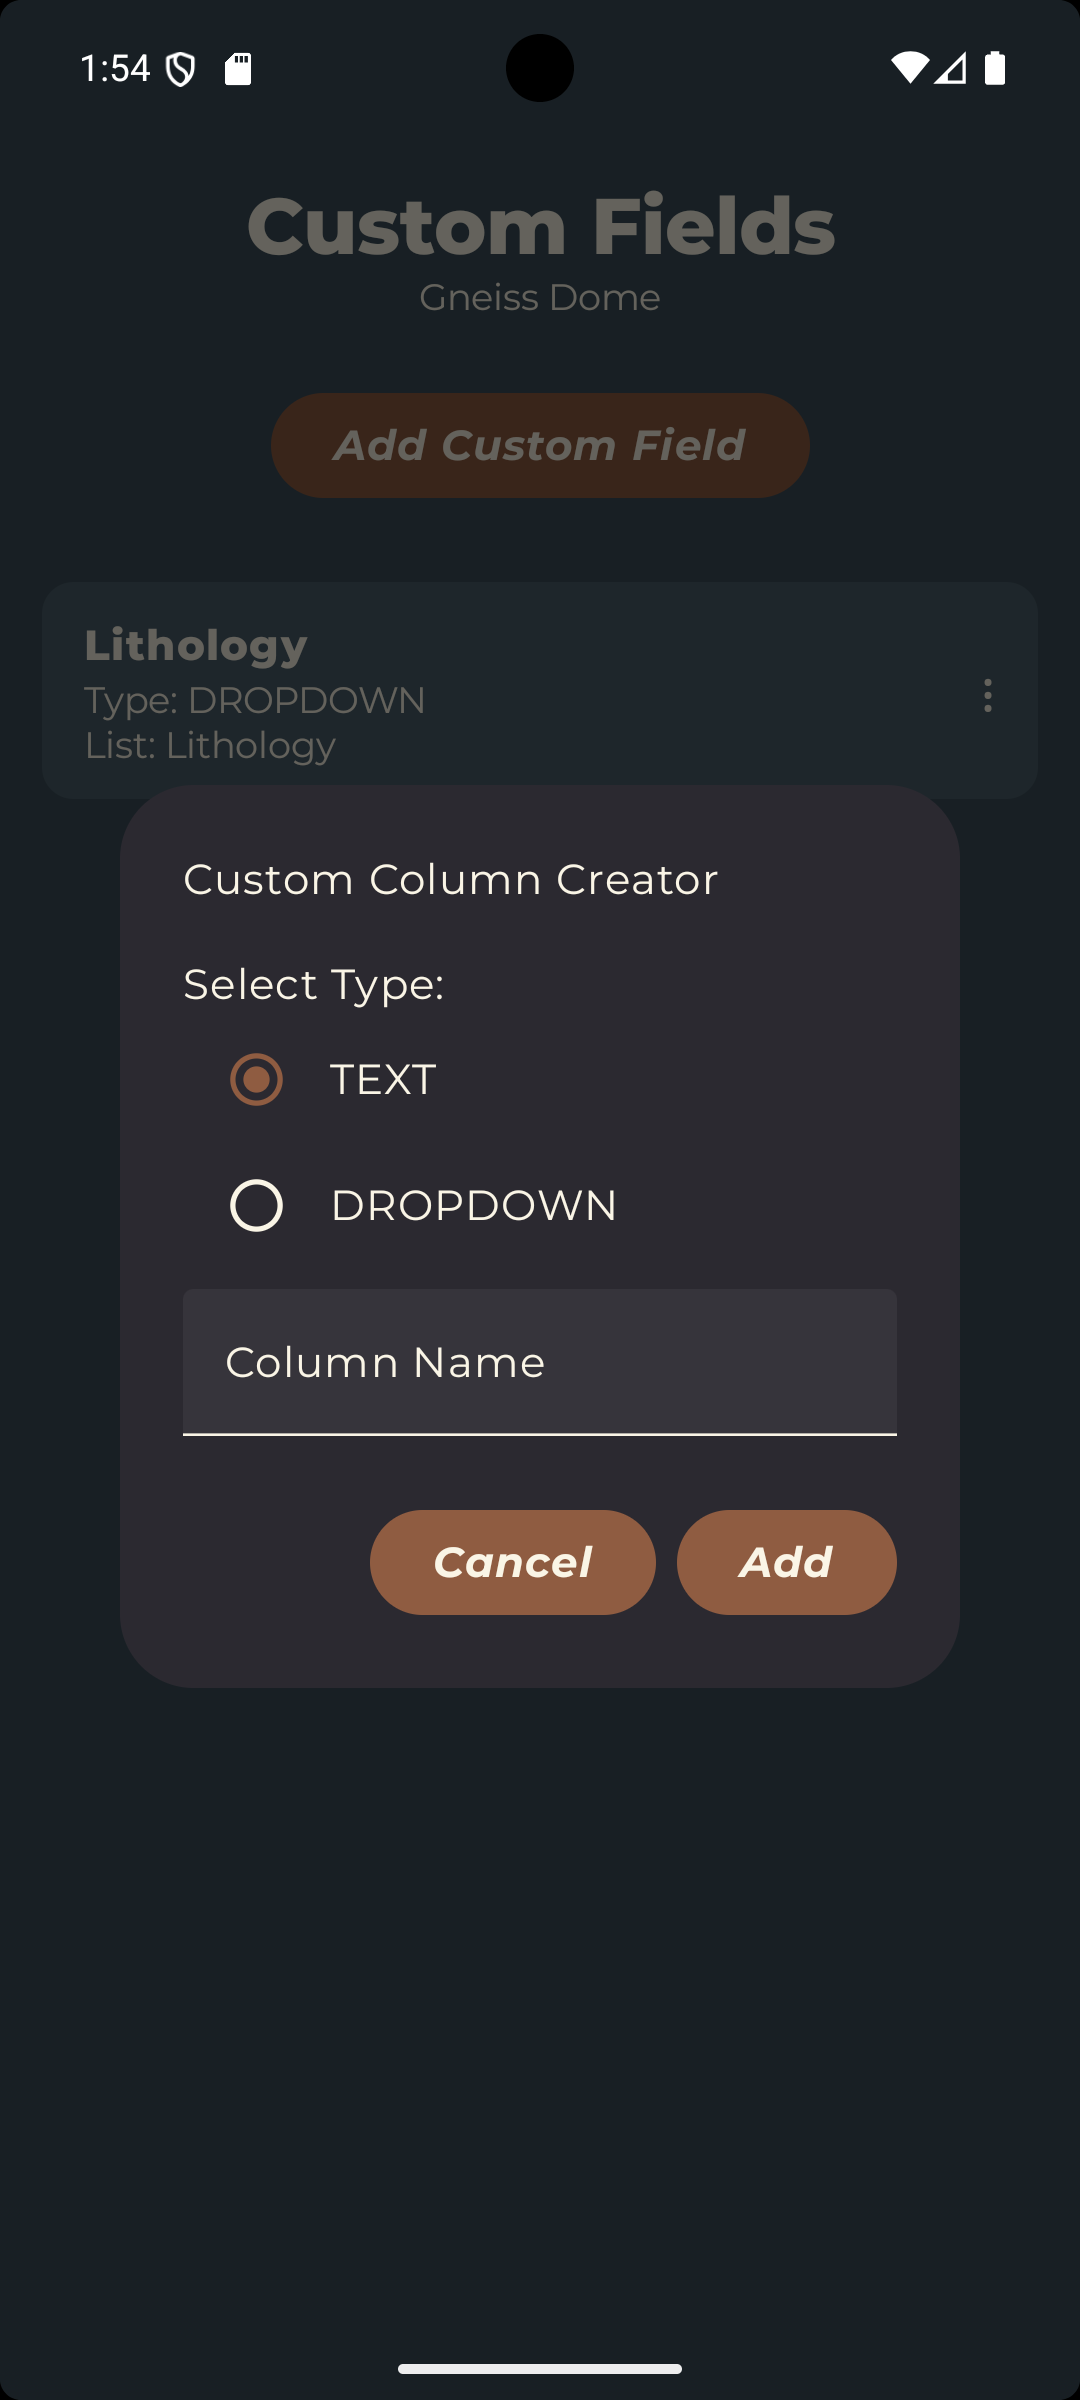
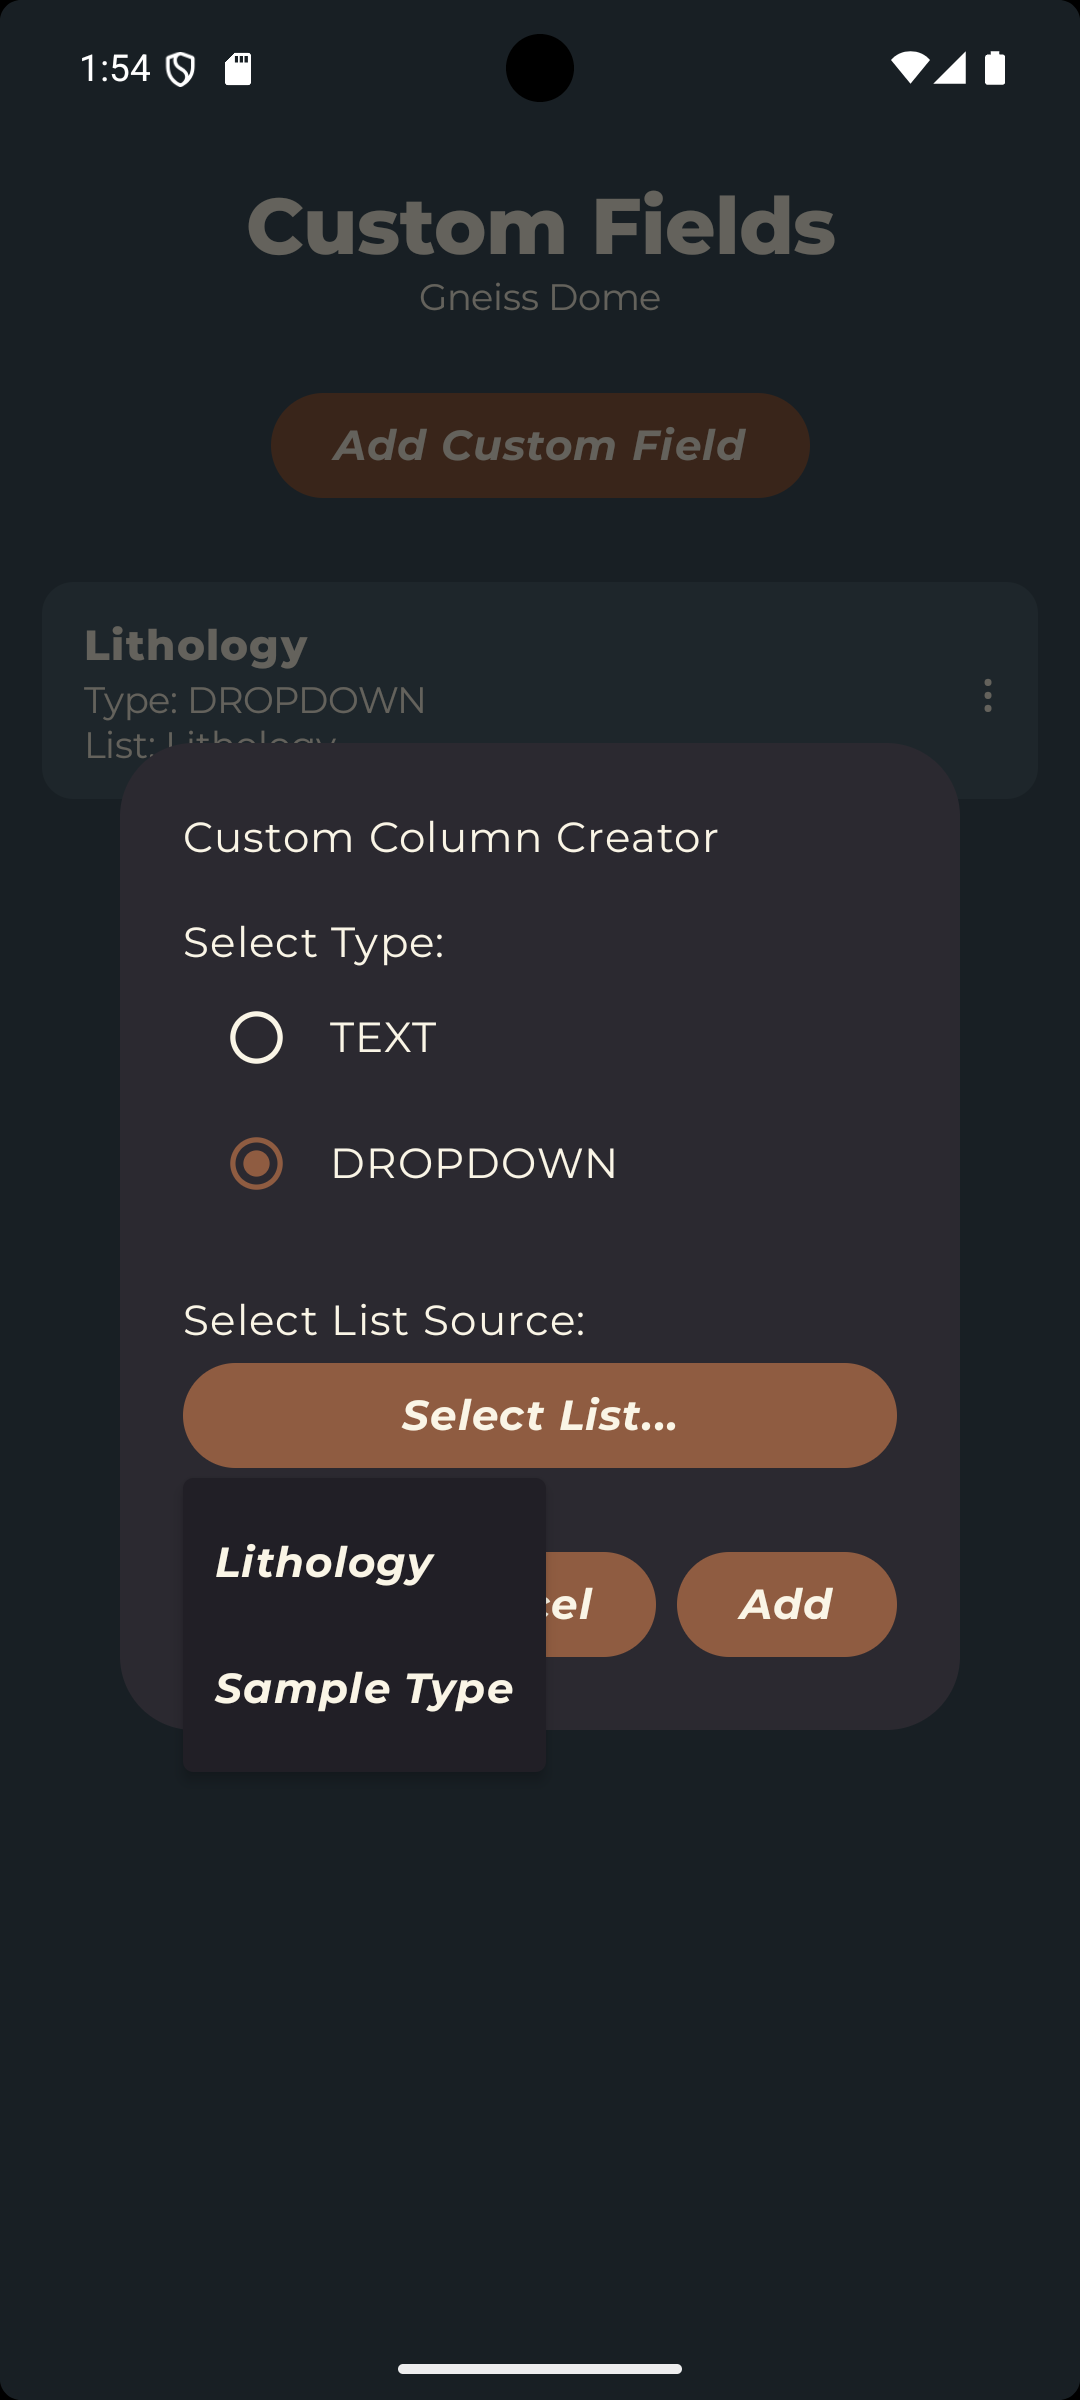
Tapping the "Manage Custom Fields" option will take you to the Custom Field Manager where you can add or remove additional fields for your dataset. Custom fields can be either text fields or dropdown fields. To create a text field, simply enter a name for the field. To create a dropdown field, you must select an existing picklist to populate the dropdown options. Then tap "Add". Custom fields are specific to each dataset, so they will not be shared across projects like picklists are.
Now everything is setup and ready to collect data. Tap the back button to return to the Project Setup screen.
Step 4 — Collecting Structures: The Clinometer Tool
Tapping a Structure Dataset will bring you to the Clinometer Tool, where you can begin collecting structural measurements. Upon opening this tool, you will be asked to provide permission to use the device GPS location. It will be best to use the precise location option if your device supports it, but the standard location option will also work. StrucTool does not collect or store any location data outside of your device, so your data is safe and private. If you choose to deny location permissions, you can still use the clinometer tool, but the location fields will be disabled and your measurements will not have associated location data.
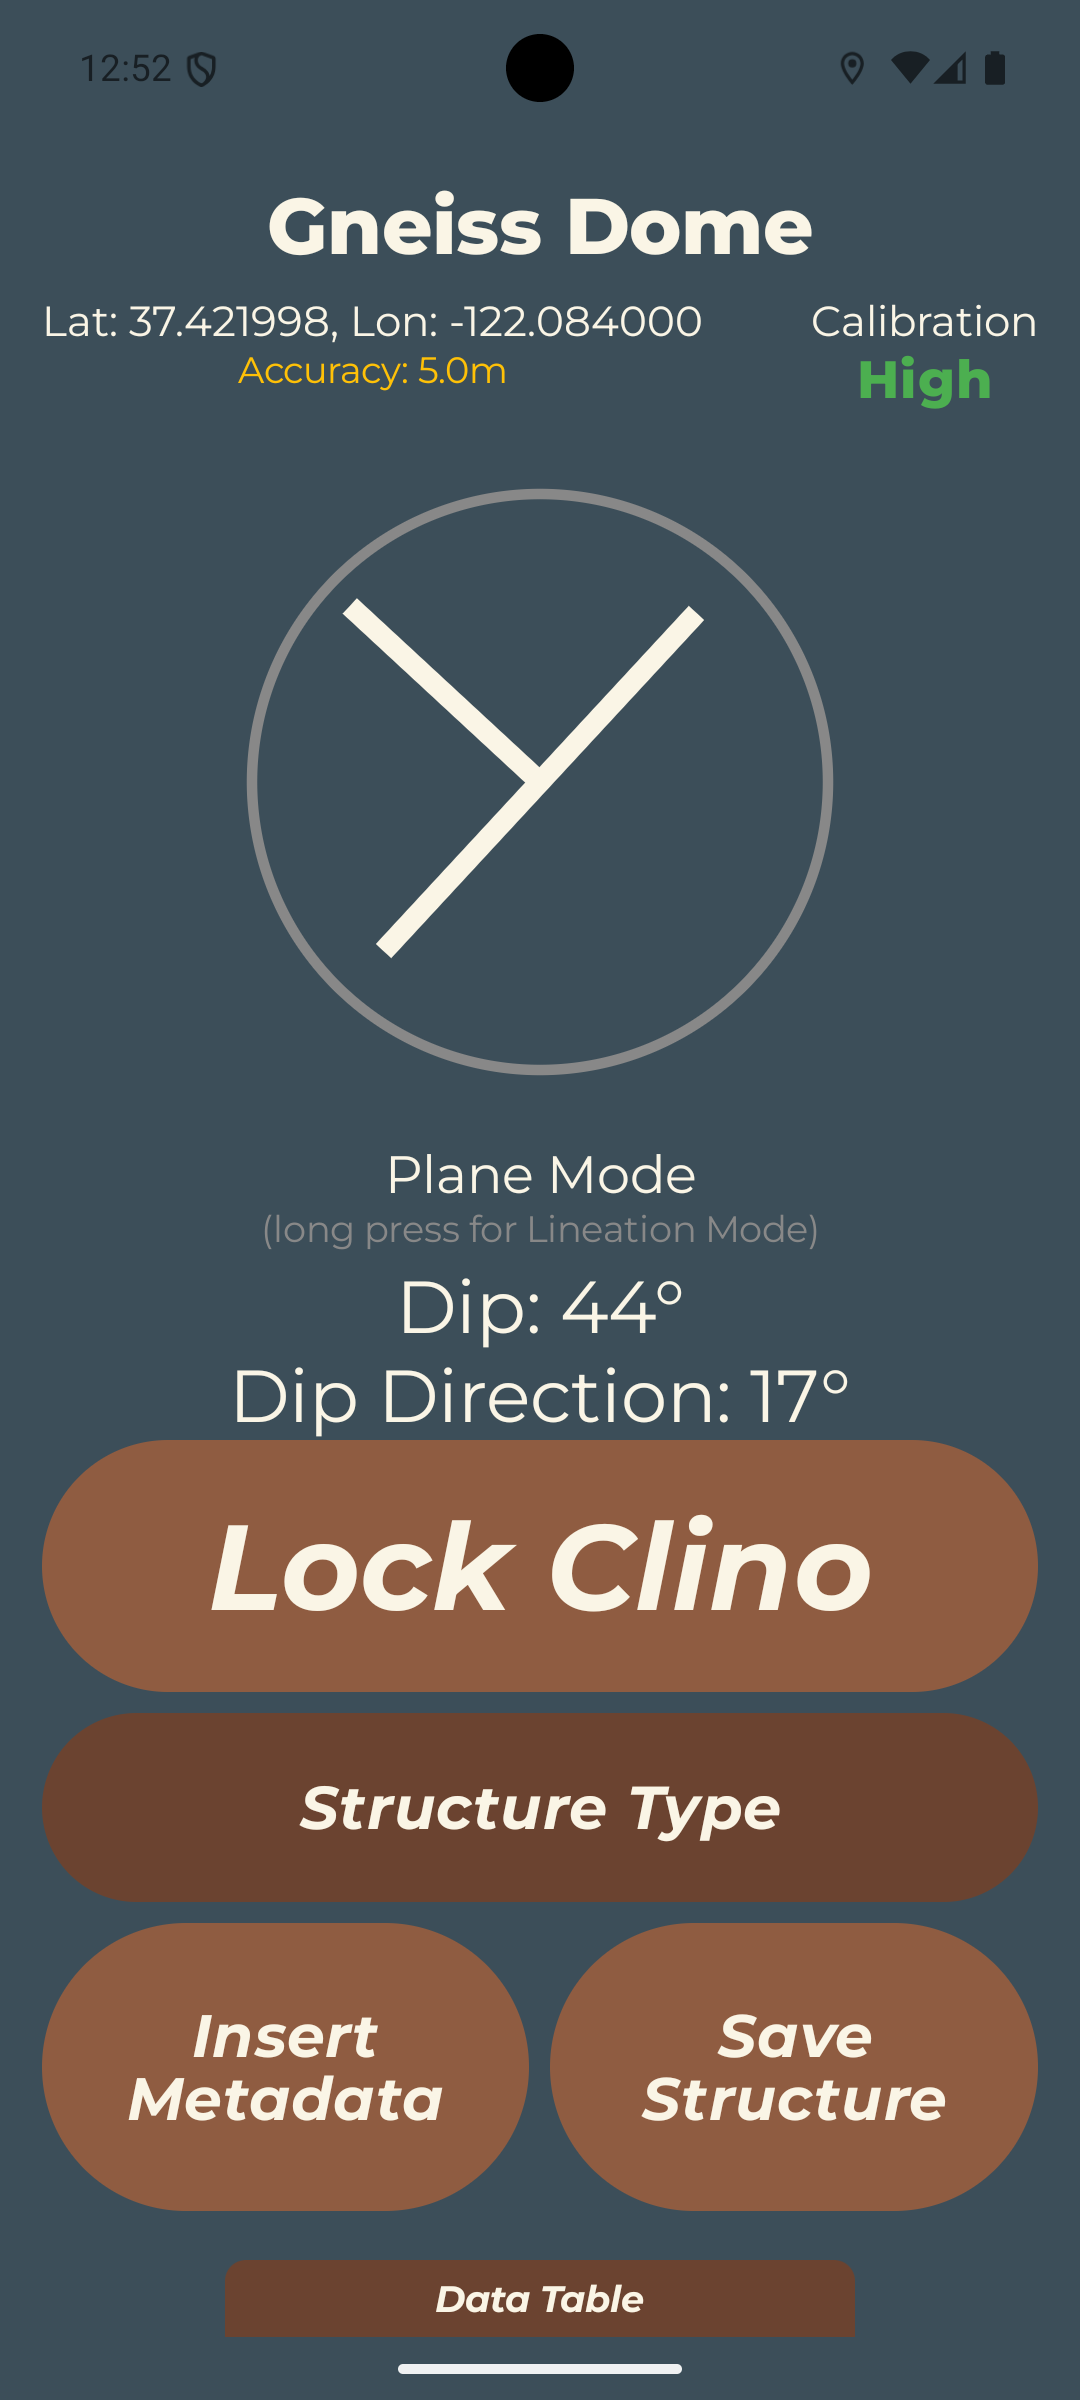
The strike/dip symbol, and measured dip and dip direction are displayed live on screen, along with the GPS location, GPS accuracy and calibration state of the accelerometers and compass. The workflow for taking a planar structural measurement is:
- Align the device with the planar structure.
- Tap "Lock Clino" to freeze the accelerometer reading.
- Select the appropriate category from the Primary Picklist...in this case "Structure Type" was chosen as the primary.
- Either tap "Insert Metadata" to fill out the other custom fields, or tap "Save Structure" to save the measurement to the data table.
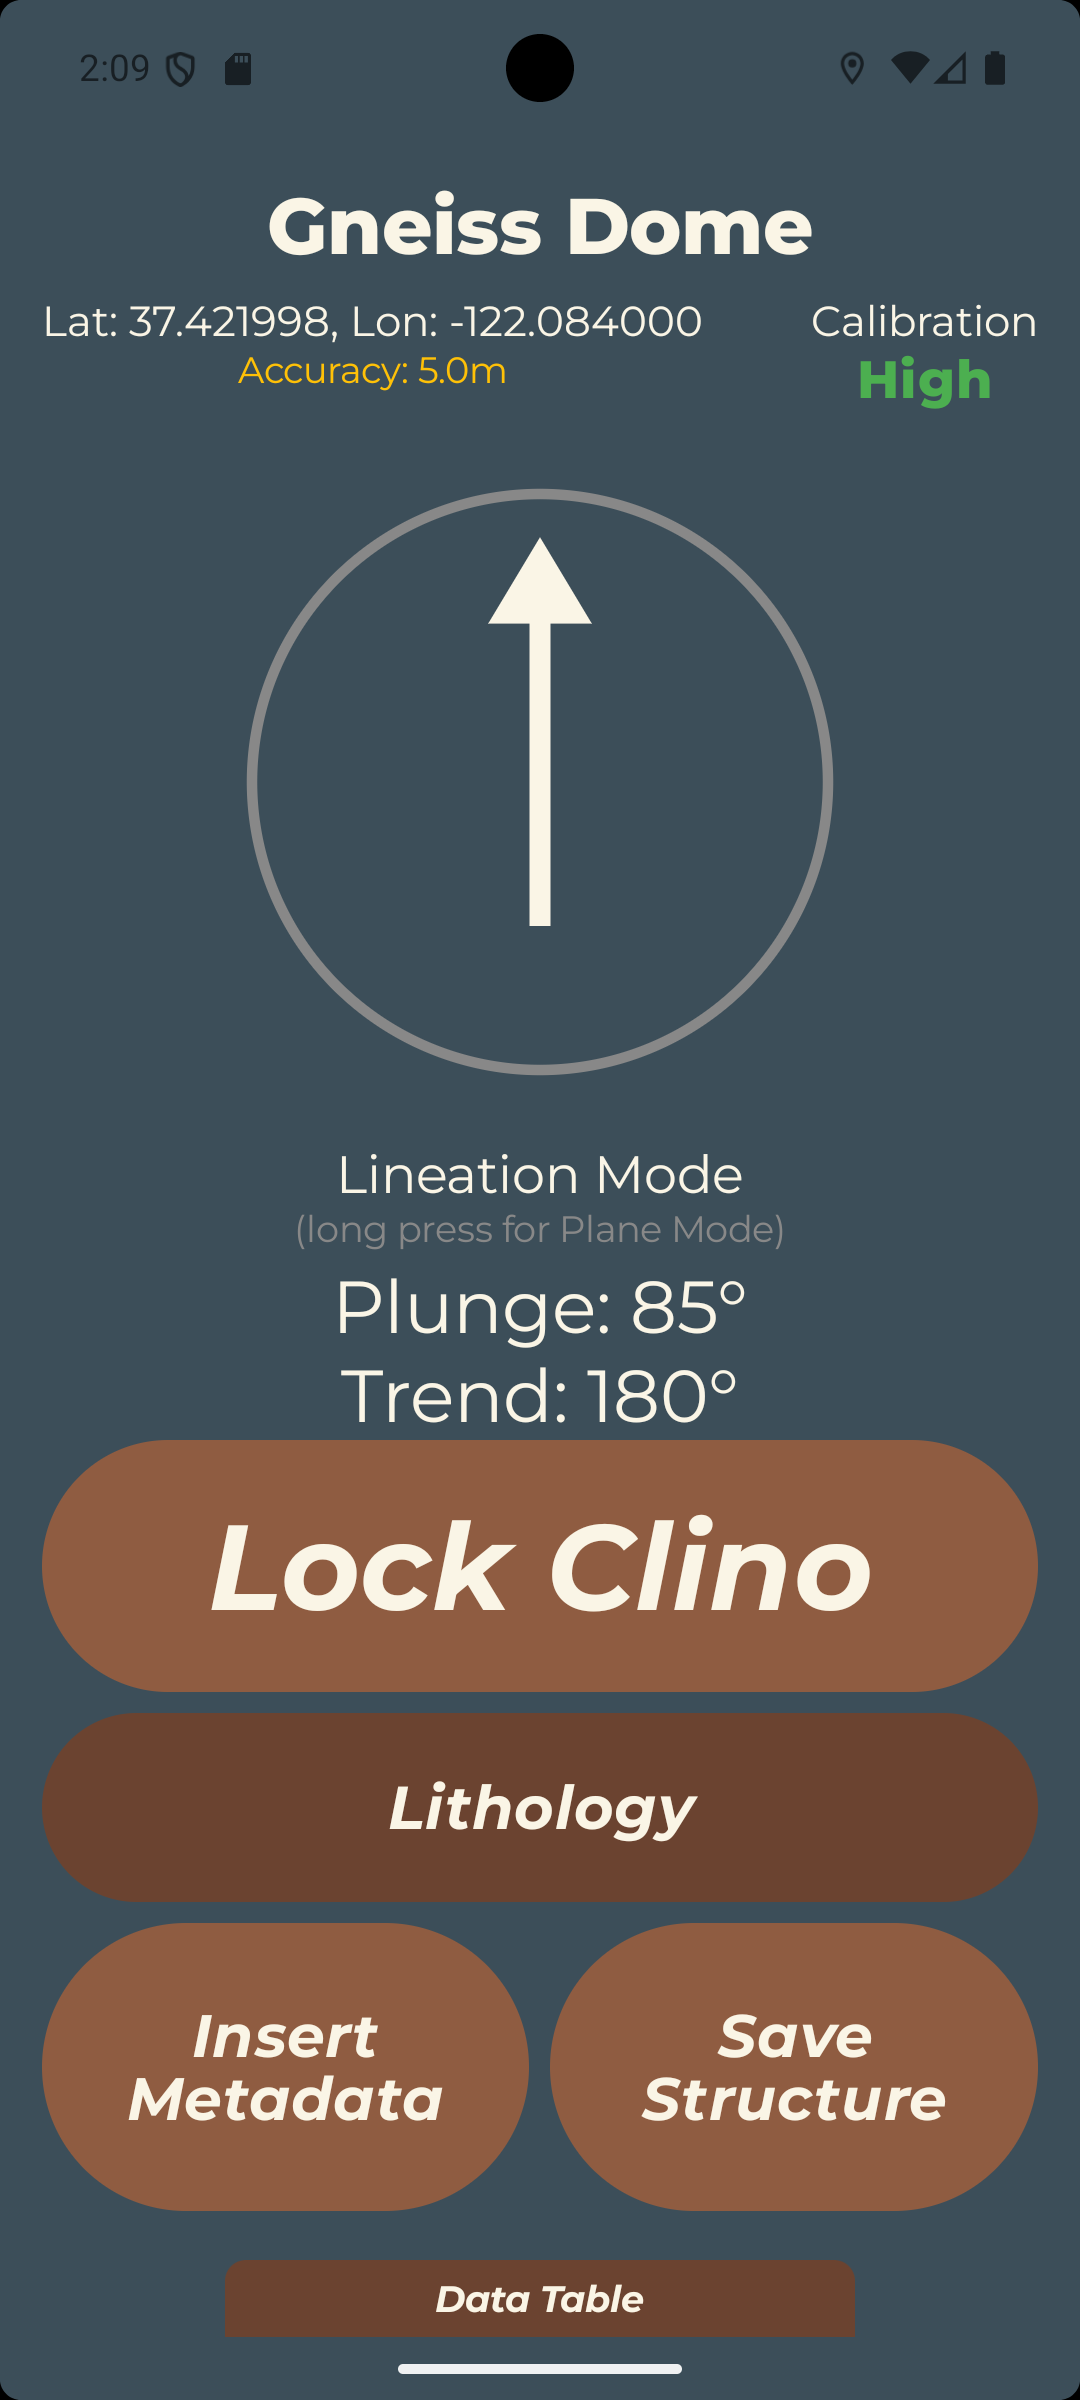
If you have a linear structure to measure, you can switch to Lineation Mode by long-pressing the strike/dip indicator. This will change the strike/dip symbol to a rake symbol and allow you to measure the trend and plunge direction of linear features. The workflow for taking a linear structural measurement is:
- Align the edge of the device with the linear structure.
- Tap the "Lock Clino" button to freeze the accelerometer reading.
- Select the appropriate category from the Primary Picklist...ideally a picklist category that matches your linear structure.
- Either tap "Insert Metadata" to fill out the other custom fields, or tap "Save Structure" to save the measurement to the data table.
- To switch back to Planar Mode, long-press the lineation symbol.
When recording in Lineation Mode, the metadata dialog also shows a "Link to Plane" button. This lets you associate a lineation with the planar structure it lies on — for example, slickenlines on a fault surface or a mineral lineation on a foliation plane. To link a lineation to a plane:
- Record the planar structure first (in Plane Mode) so it exists in the dataset.
- Switch to Lineation Mode, measure the lineation, and tap "Insert Metadata".
- Tap "Link to Plane" and choose the target plane from the list of previously recorded planar measurements (shown with their ID, dip, and dip direction).
- The chosen plane's ID and orientation are attached to the lineation. Tap "Unlink" at any time to clear the association.
Linked planes appear in the data table (as #ID (dip/dir)) and are included in the CSV export, preserving the relationship between the lineation and its host plane.
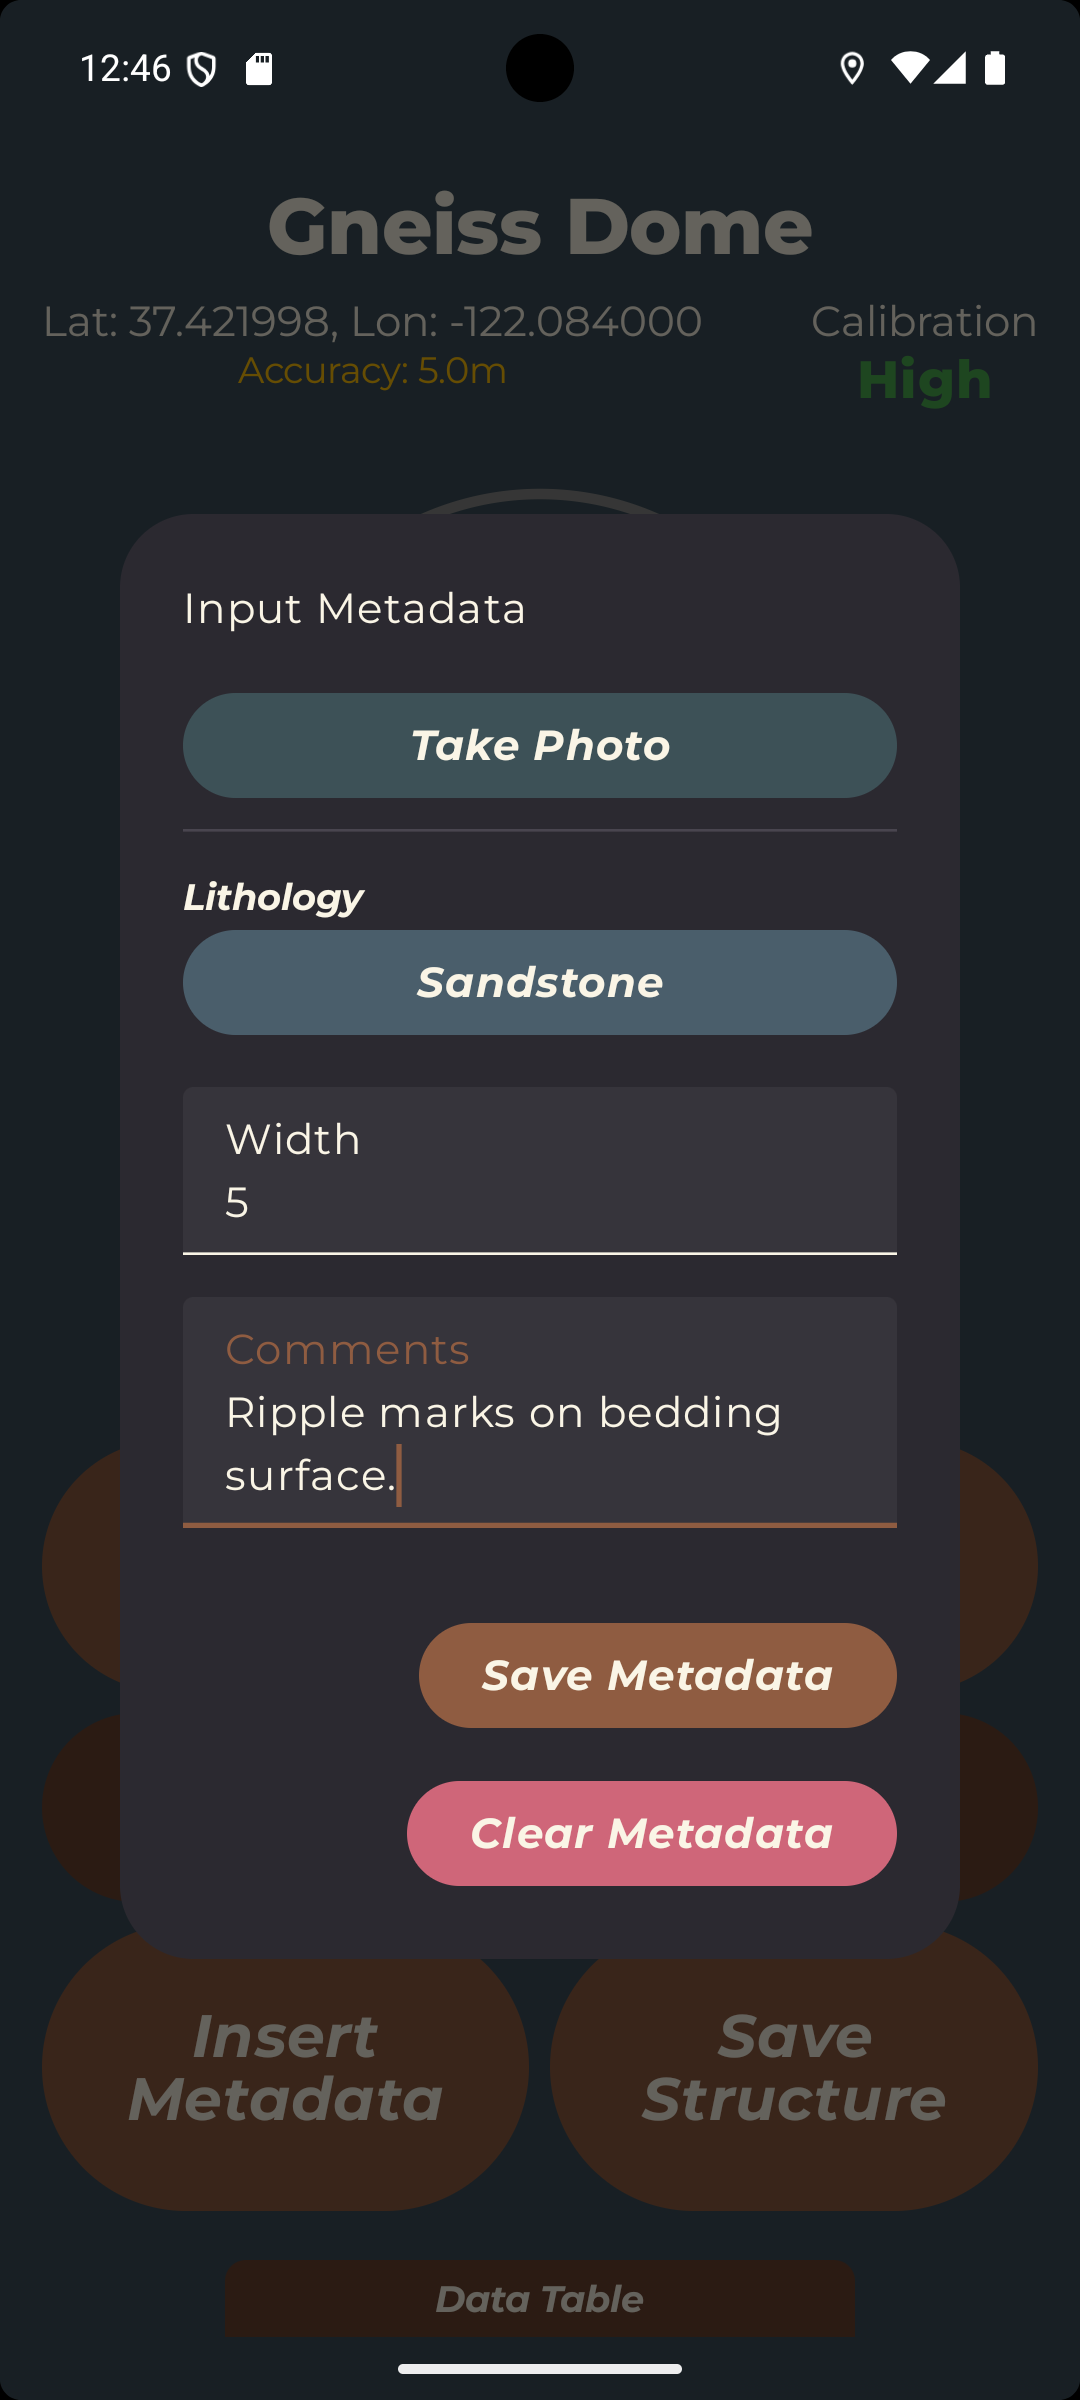
For either Plane Mode or Lineation Mode, tapping "Insert Metadata" will bring up a dialog box that allows you to fill out information in all the additional custom fields selected for this dataset. The "Take Photo" button will allow you to capture a photo of the measured structure, labelled with the Dataset name, entry number and primary picklist label. When you have finished adding the additional information, tap "Save Metadata" to save the information, or "Clear Metadata" to clear these fields.
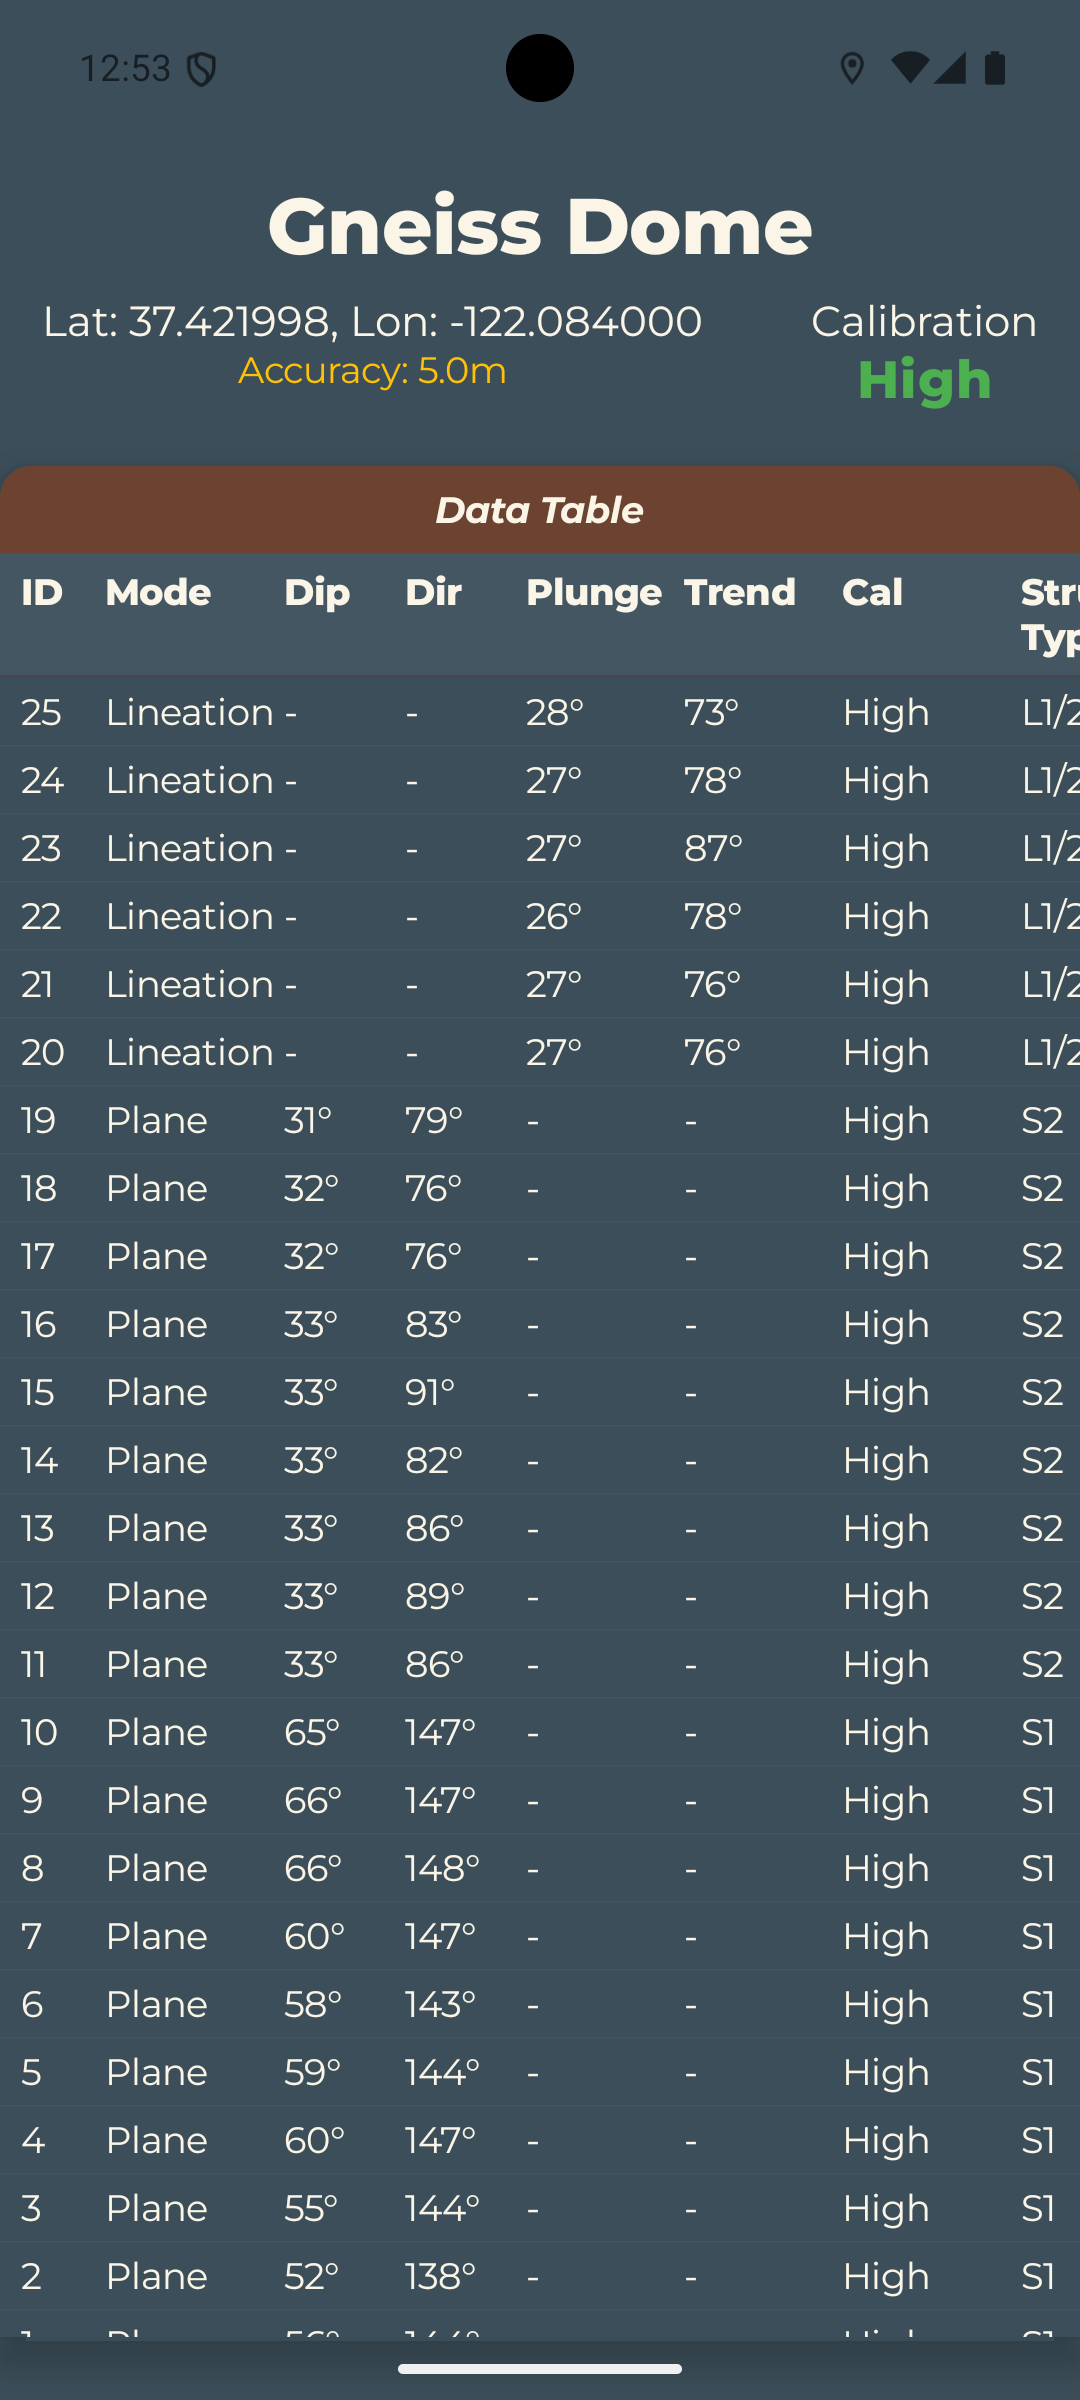
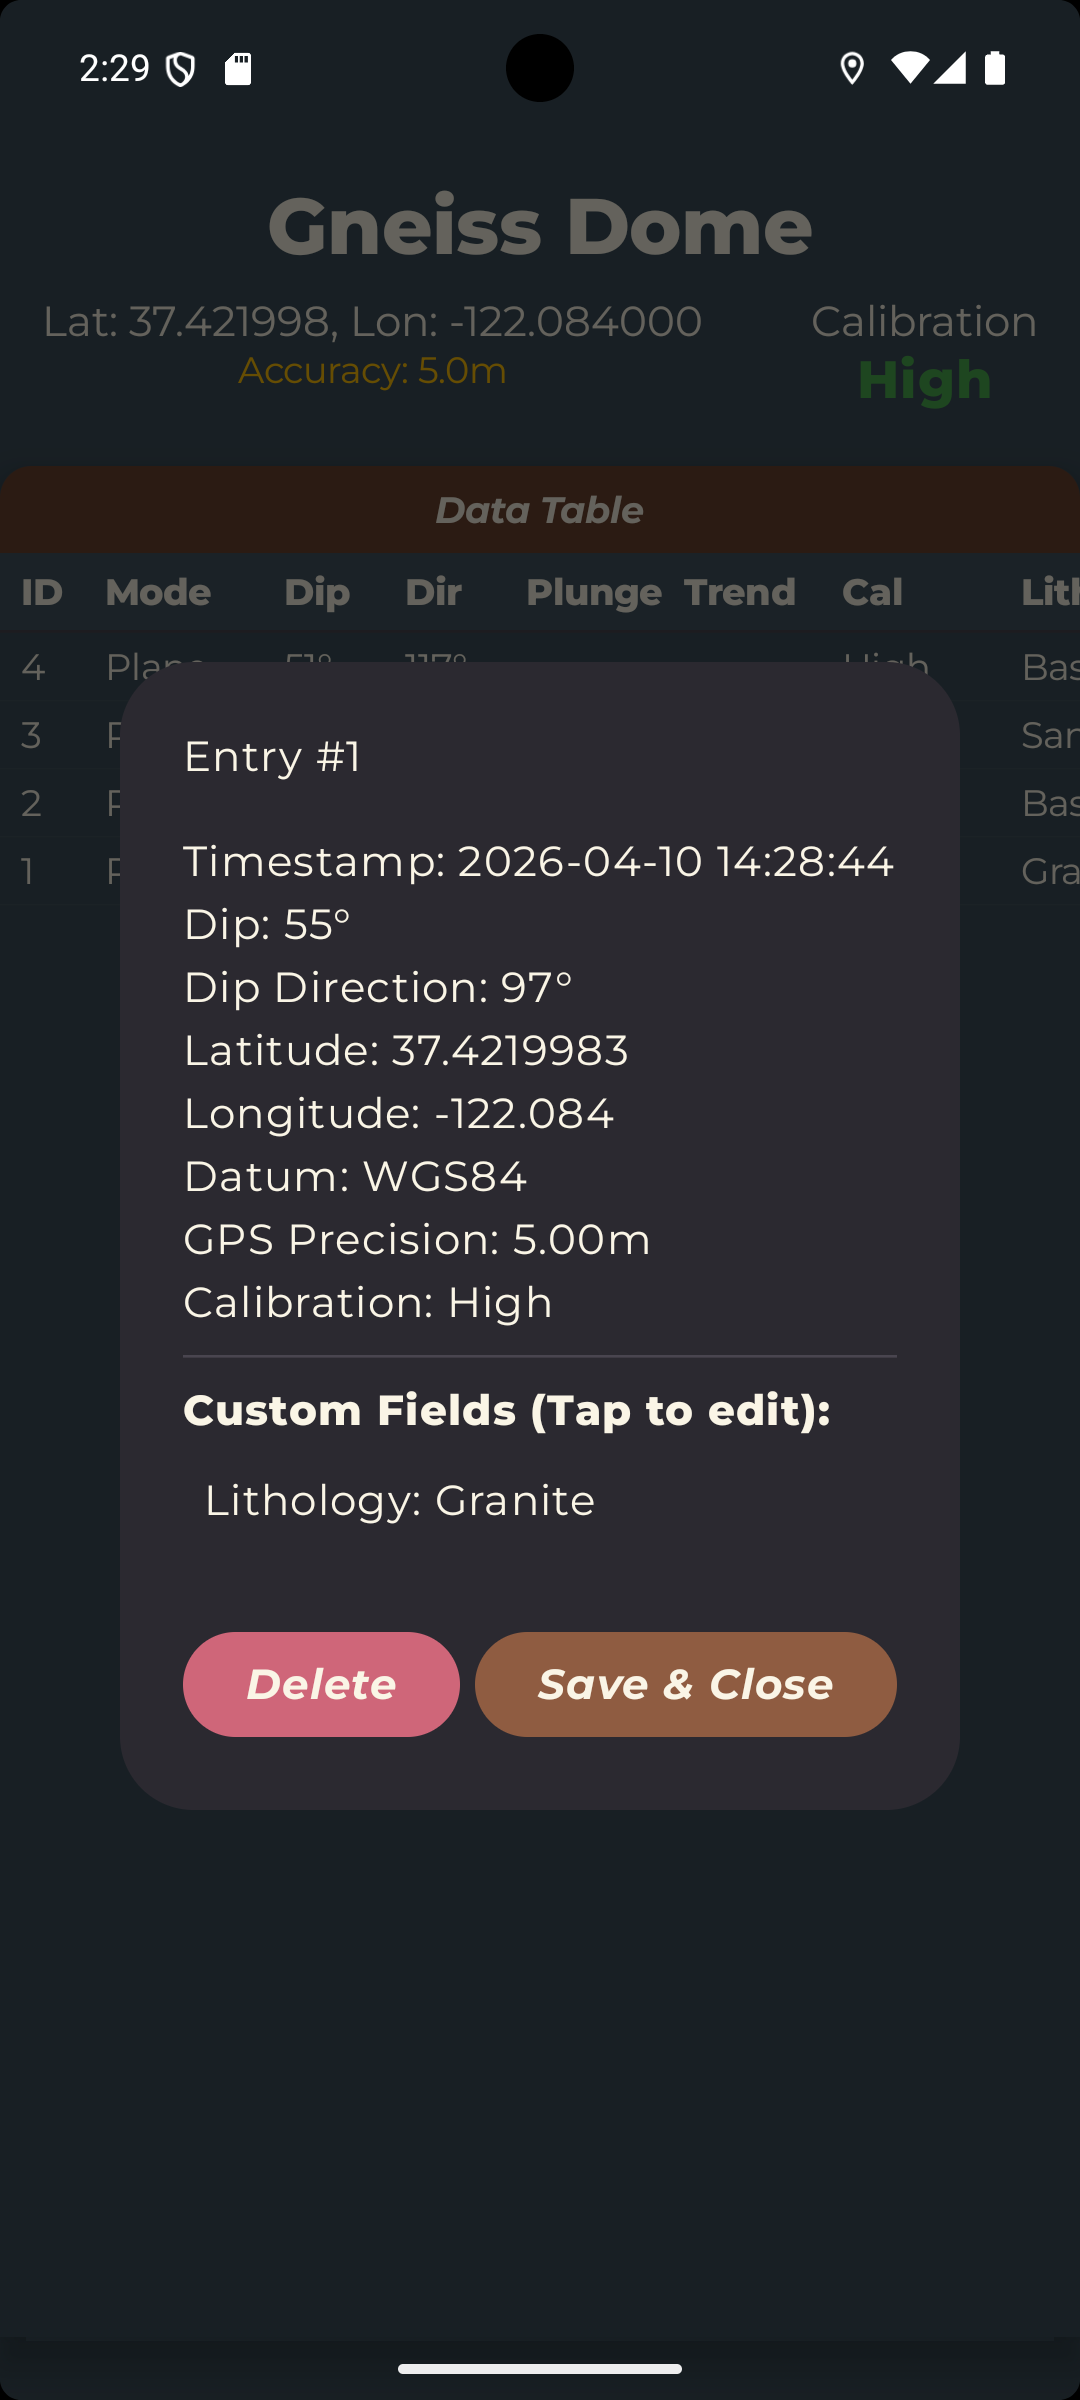
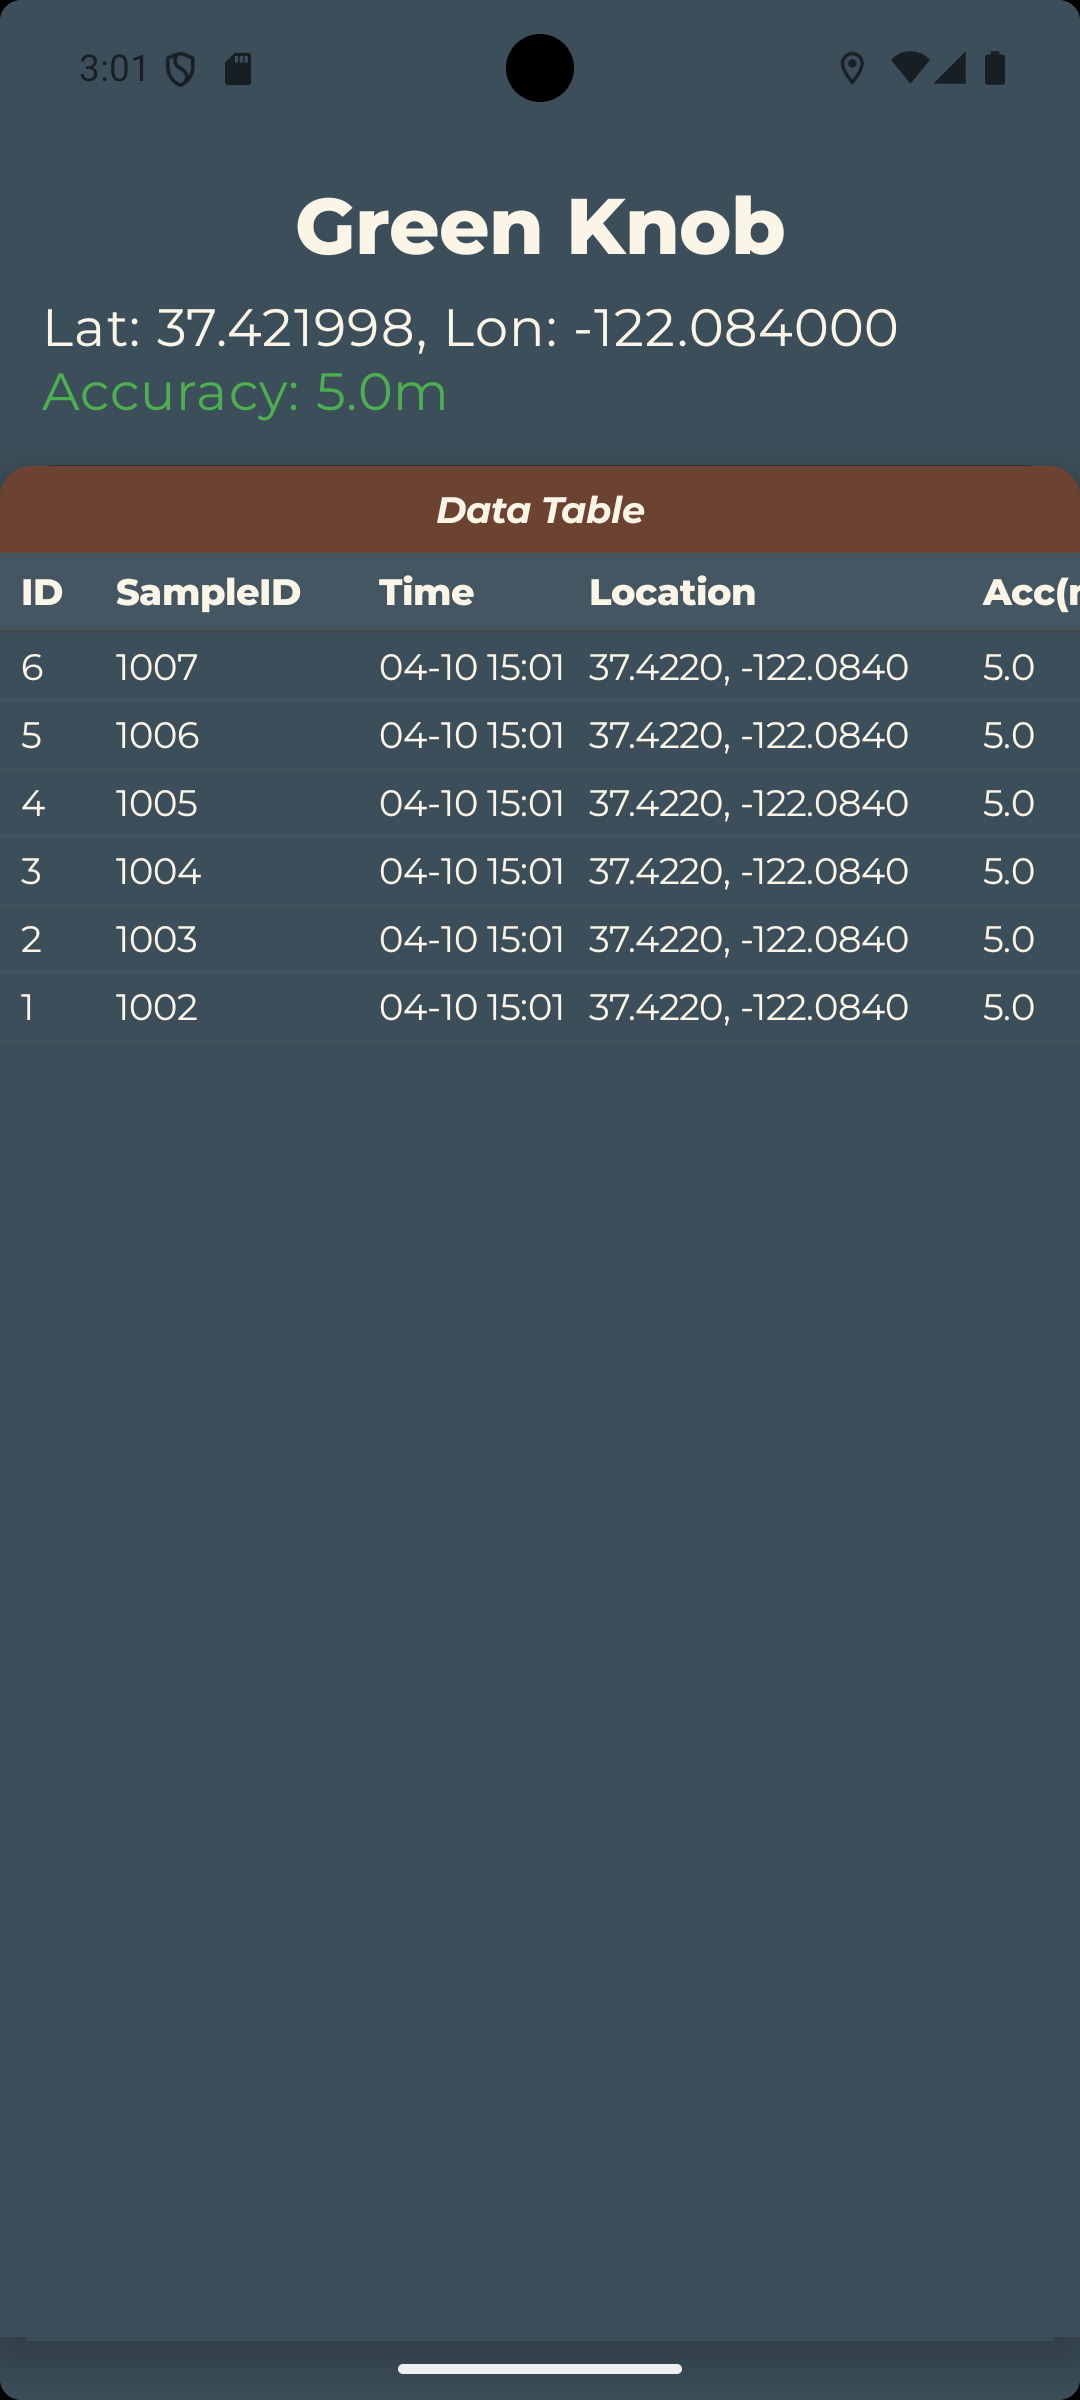
At the bottom of the screen, you can also see a live data table that shows all the measurements you have taken in this dataset. Tap the "Data Table" box to extend or hide the table. This table will update in real-time as you take measurements, and it will also show the associated metadata for each measurement. You can scroll through this table to review your measurements and ensure everything is being recorded correctly.
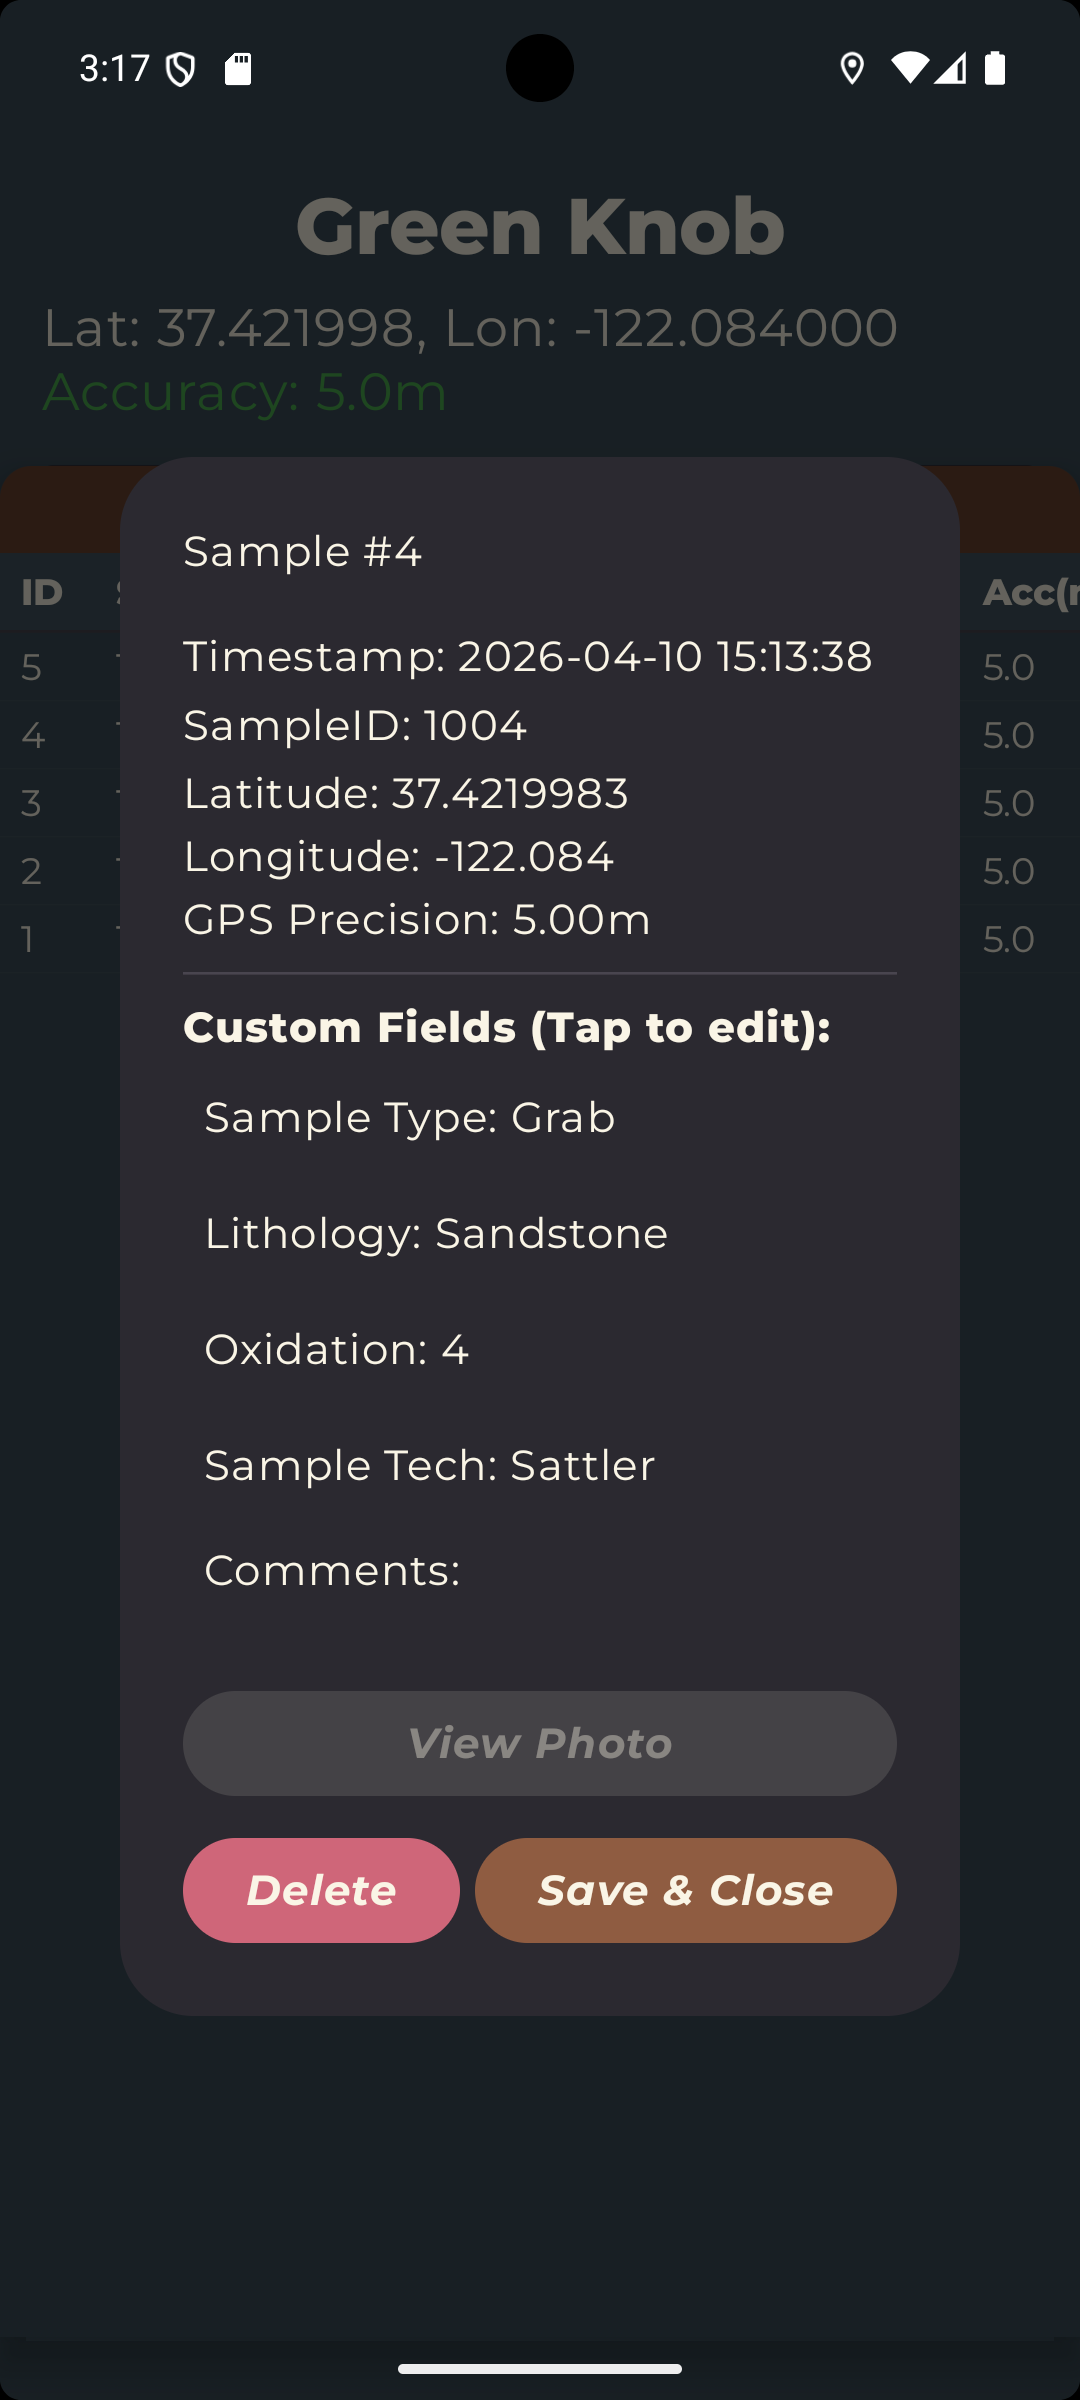
Tapping on an entry will bring up a dialog that allows you to edit the measurement metadata or delete the measurement entirely. This is useful for correcting any mistakes or adding additional information after the measurement has been taken.
When you are finished collecting measurements, or at any other time, tap the back button to return to the list of datasets, or go back to the home screen to switch between Clinometer and Sample collection modes.
Step 5 — View Structures on a Stereonet
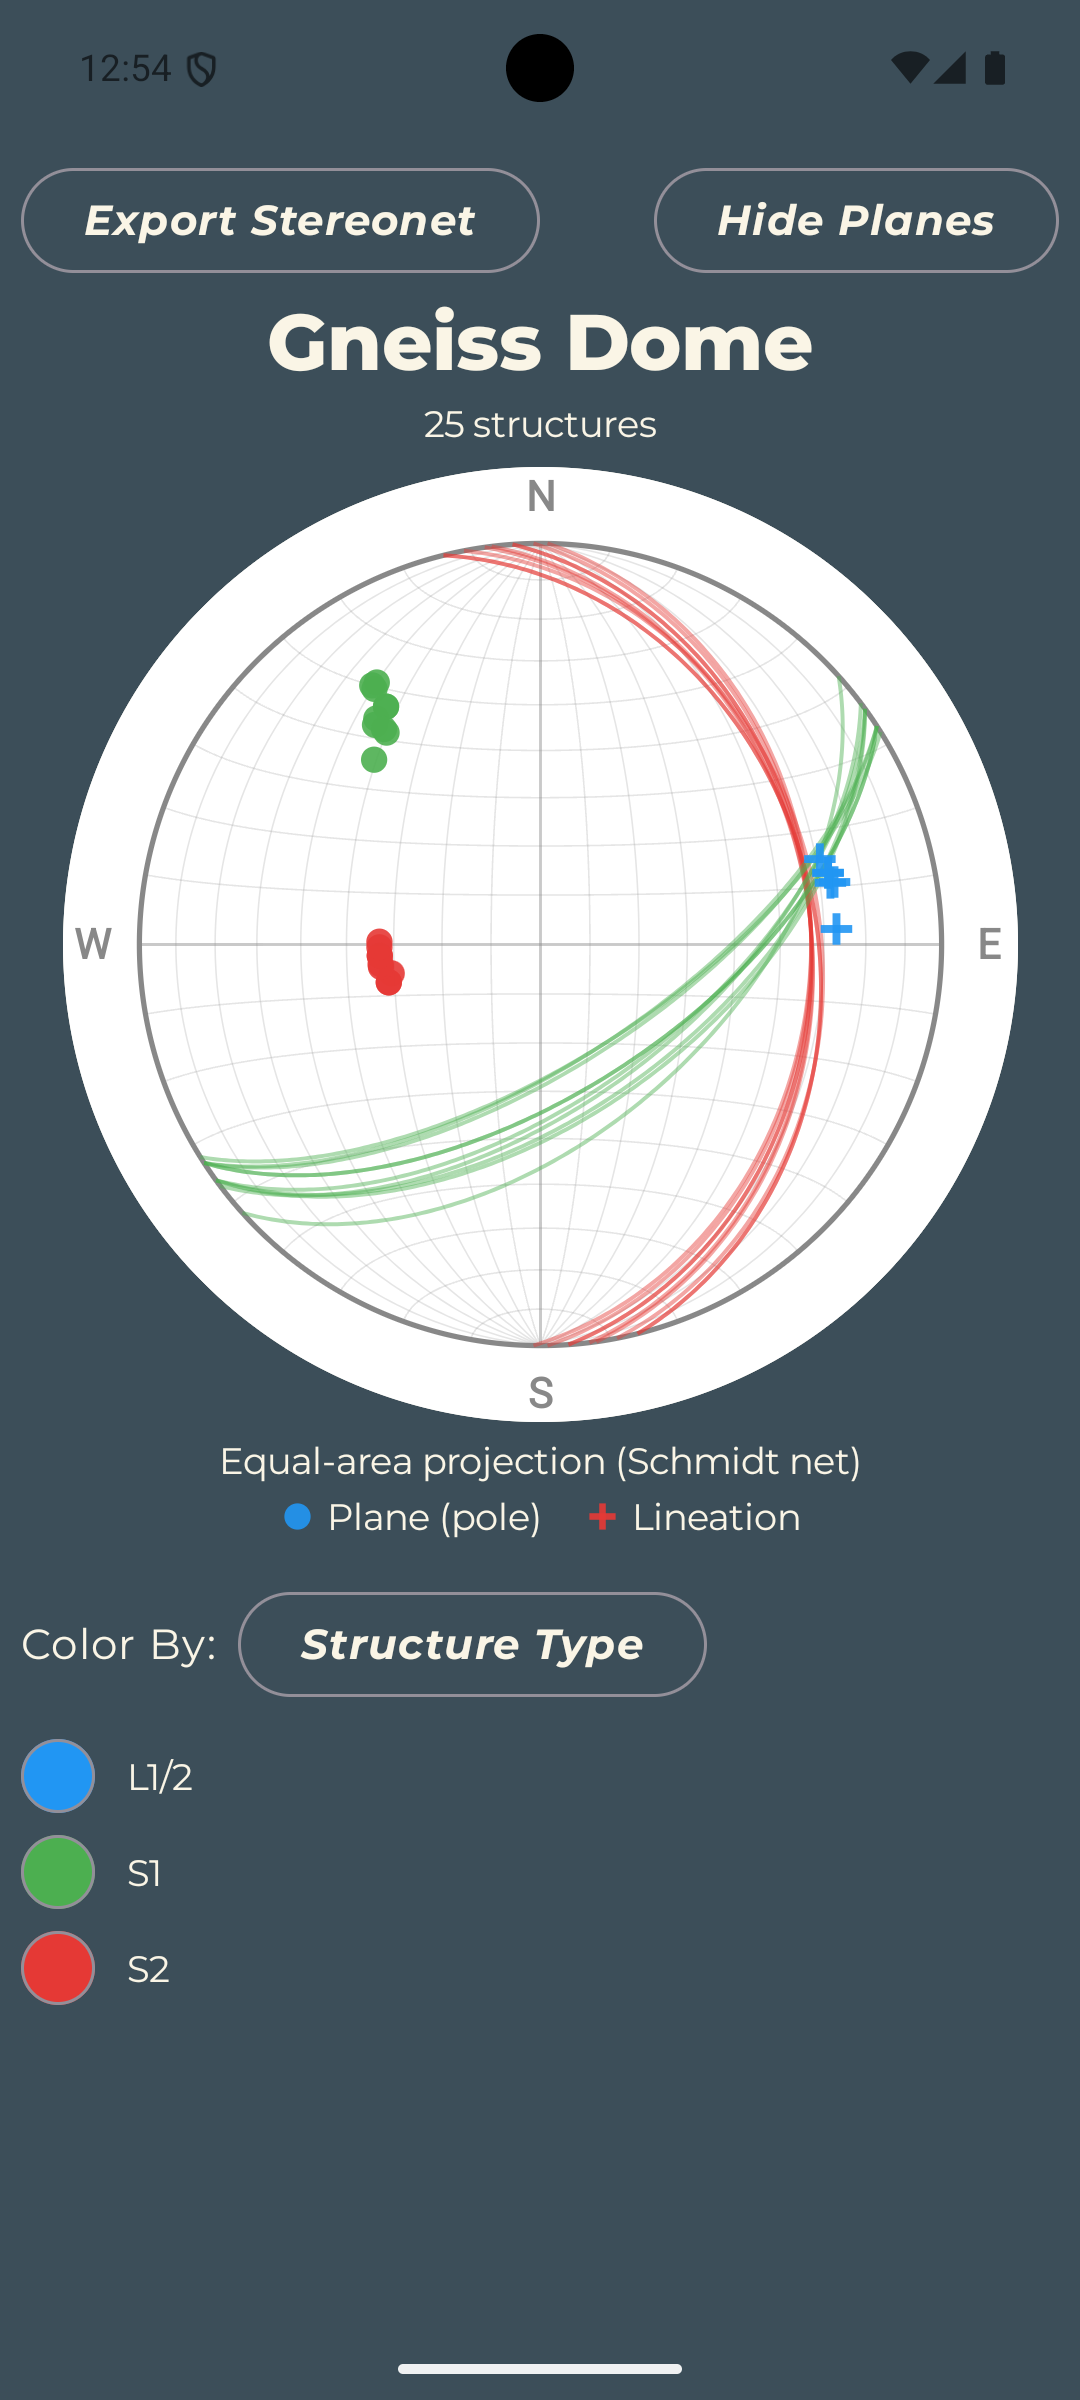
In the project setup screen, long-pressing a dataset and selecting "View Stereonet" will bring up a stereonet visualization of your structural measurements.
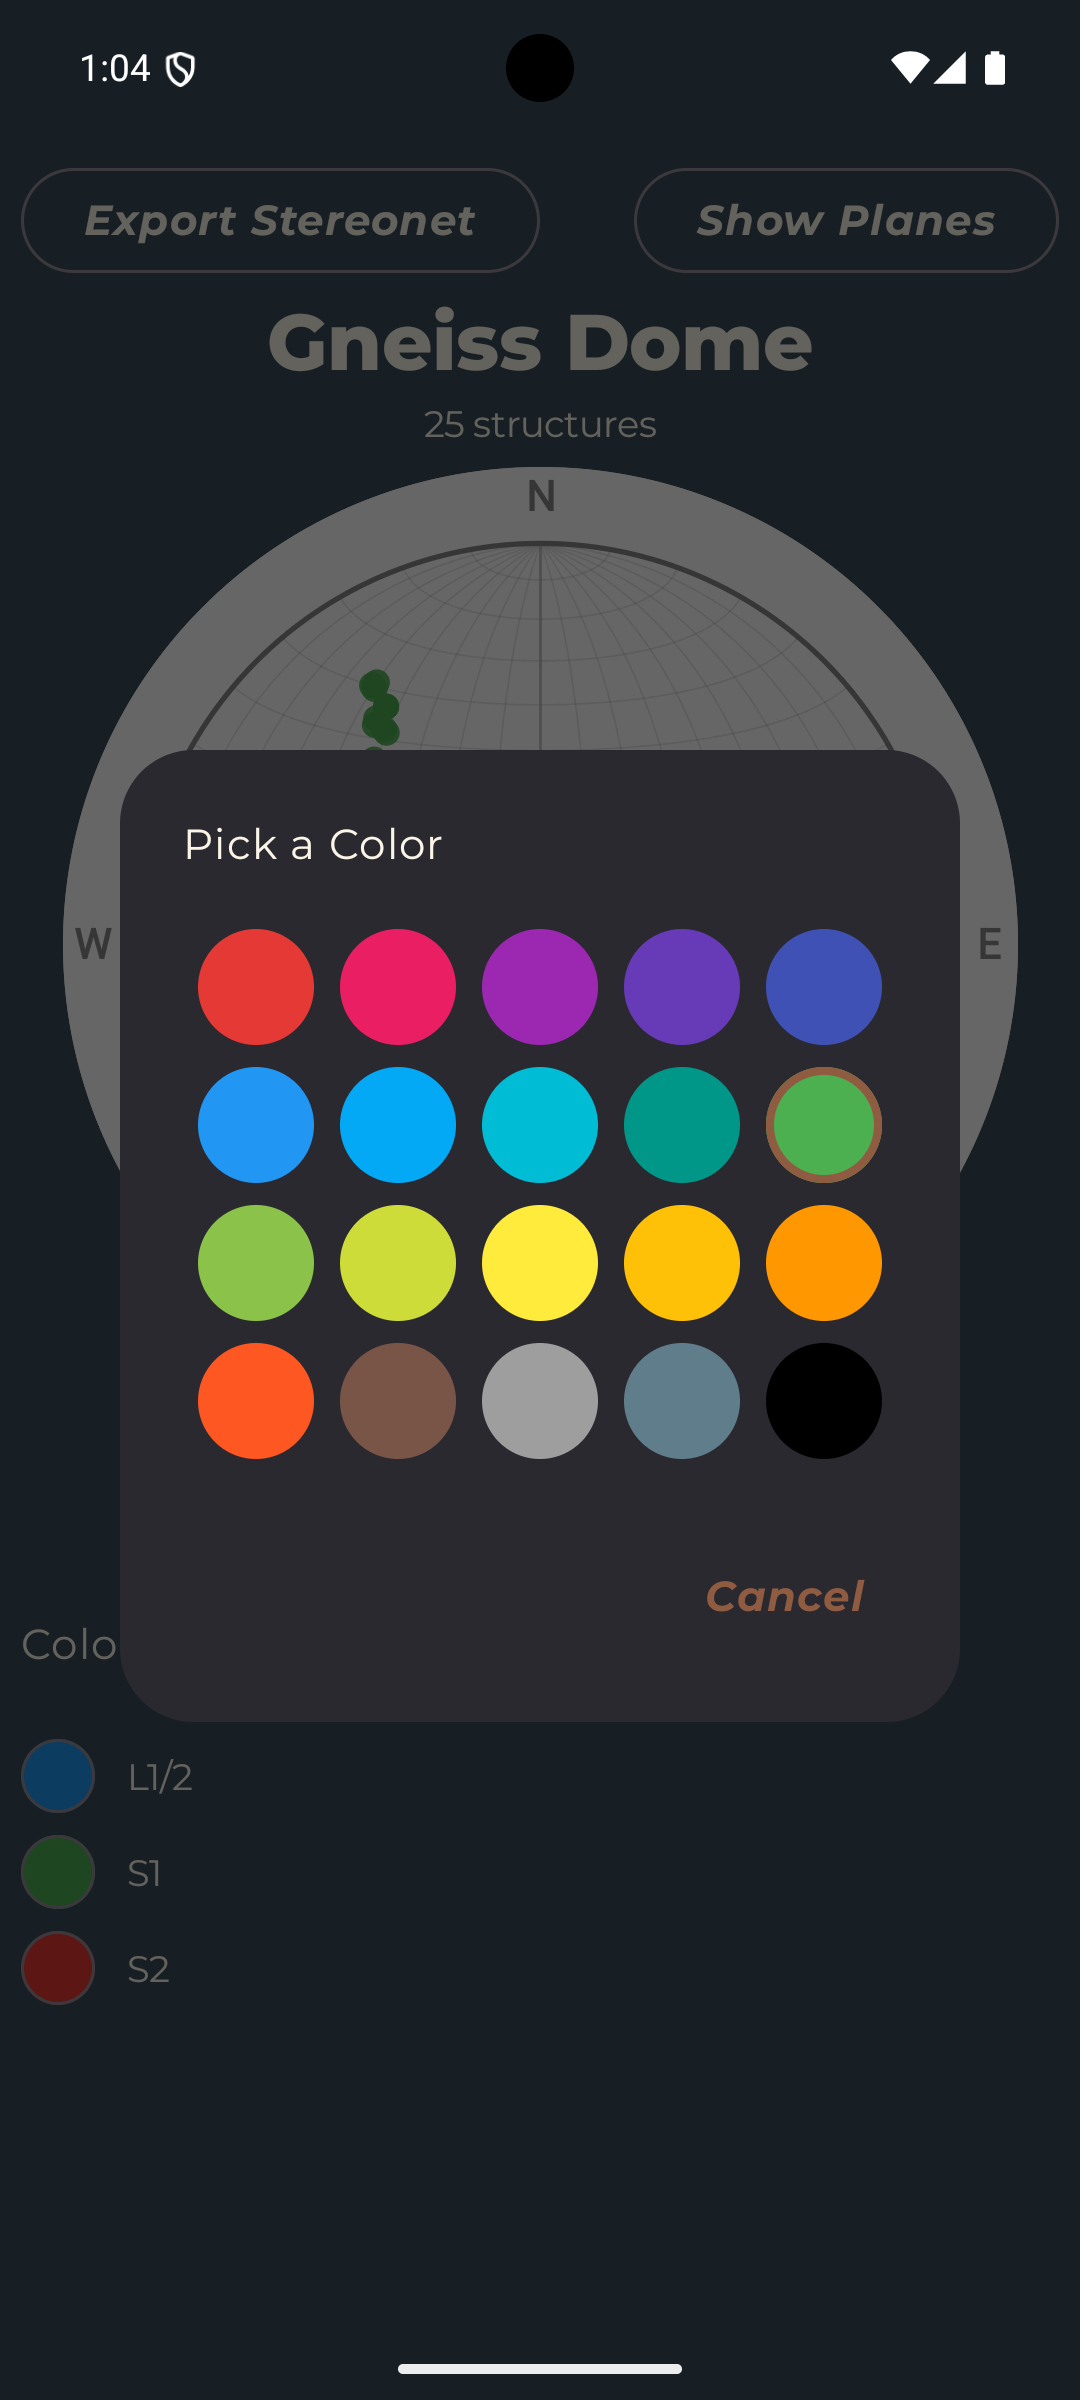
The stereonet will plot all the planar and linear measurements from your dataset on an Equal-area projection (Schmidt) stereonet. The poles of planar measurements are symbolized by dots, while linear measurements are represented by plus signs. You can use the controls at the bottom of the screen to color code the measurements by any available custom field and customize the appearance of the plot. Tapping the "Color By" button will allow you to select any custom field to color code the measurements. Tapping a color swatch will allow you to customize the color scheme for that category. You can also toggle the visibility of the great circle plane projections by tapping "Show Planes/Hide Planes" in the top right corner. Once you have finished customizing the plot, save it or share it with others by tapping "Export Stereonet" in the top left corner. This will save the stereonet as an image file that can be accessed from your device's photo gallery or shared through other apps.
Step 6 — The Sample Collection Tool
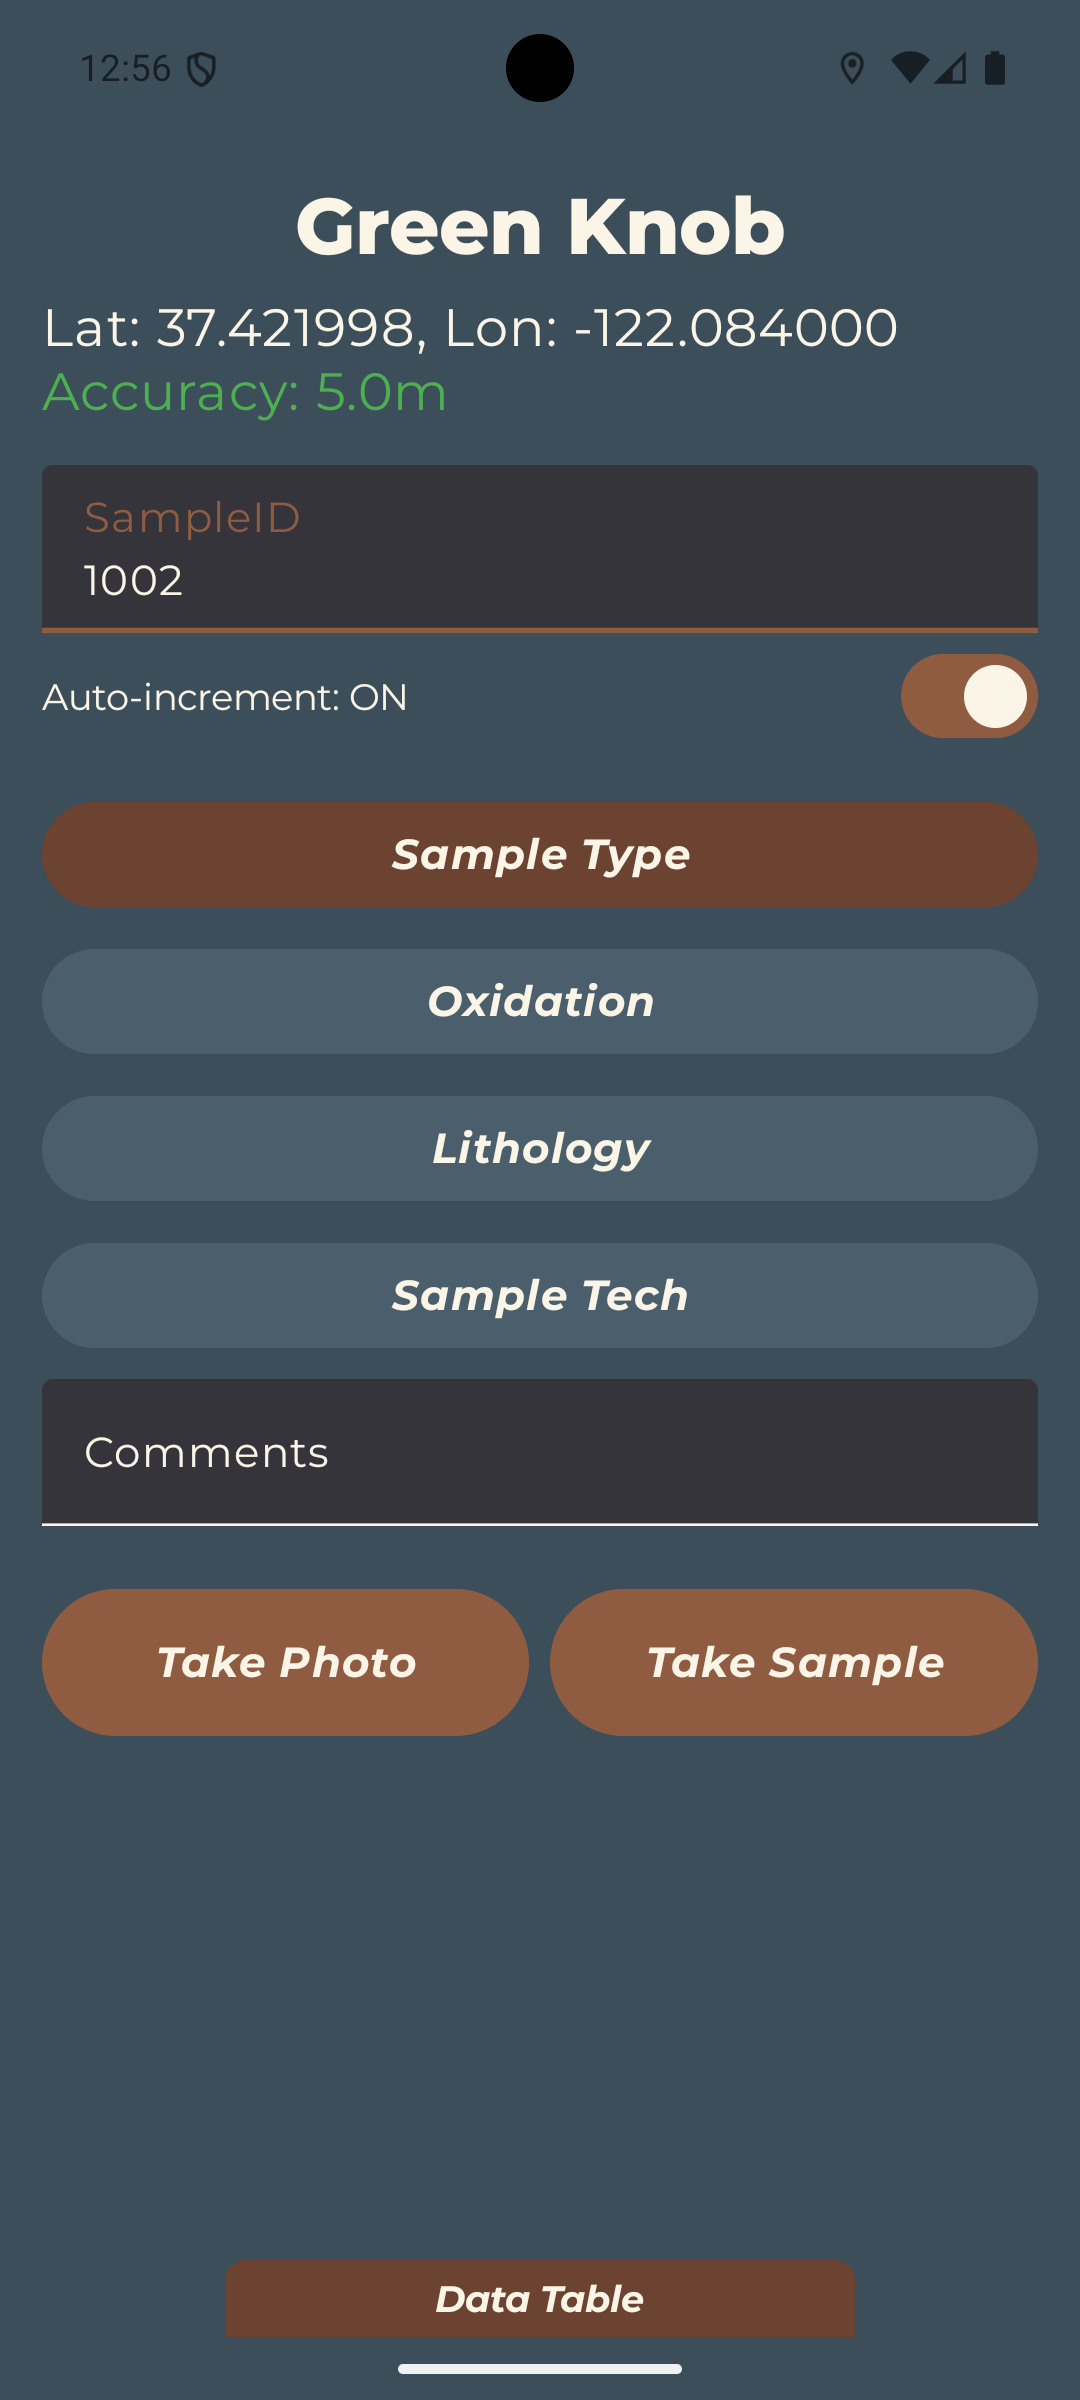
The sample collection tool is your digital field notebook for managing samples in the field. The workflow for using the sample collection tool is similar to the clinometer tool, but instead of taking structural measurements, you are taking sample measurements and recording metadata about your samples.
To take a sample, enter a sample ID and enter data into the chosen custom fields. Rather than typing the ID by hand, you can also tap "Scan Barcode" to read a SampleID directly from a label. This opens a full-screen camera scanner — align the barcode or QR code within the on-screen box and the device will vibrate once when a code is read, placing the scanned value in the SampleID field automatically. Use "Torch: OFF/ON" in the top right to toggle the flashlight in low light, or "✕ Cancel" in the top left to close without scanning. Camera permission is requested the first time you use the scanner. The primary picklist will appear at the top is mandatory. Other fields will be optional but can be filled out to provide additional metadata about your samples. To take a photo of your sample, tap the camera icon. This will open your device's camera and allow you to take a photo. You will have to enter a sample ID before you can take a photo, as the photo will be associated with the sample ID you entered. After taking the photo, it will be saved to your device's photo gallery and also associated with the sample entry in StrucTool.
To save the sample and the associated data, tap "Take Sample".
Like the Clinometer tool, the Sample Collection tool also has a live data table at the bottom of the screen that shows all the samples you have taken in this dataset. Tapping on an entry will allow you to edit the sample metadata, view the associated photo or delete the sample entry entirely.
When you are finished collecting samples, or at any other time, tap the back button to return to the list of datasets, or go back to the home screen to switch between Clinometer and Sample collection modes.
Step 7 — The GeoCalculator
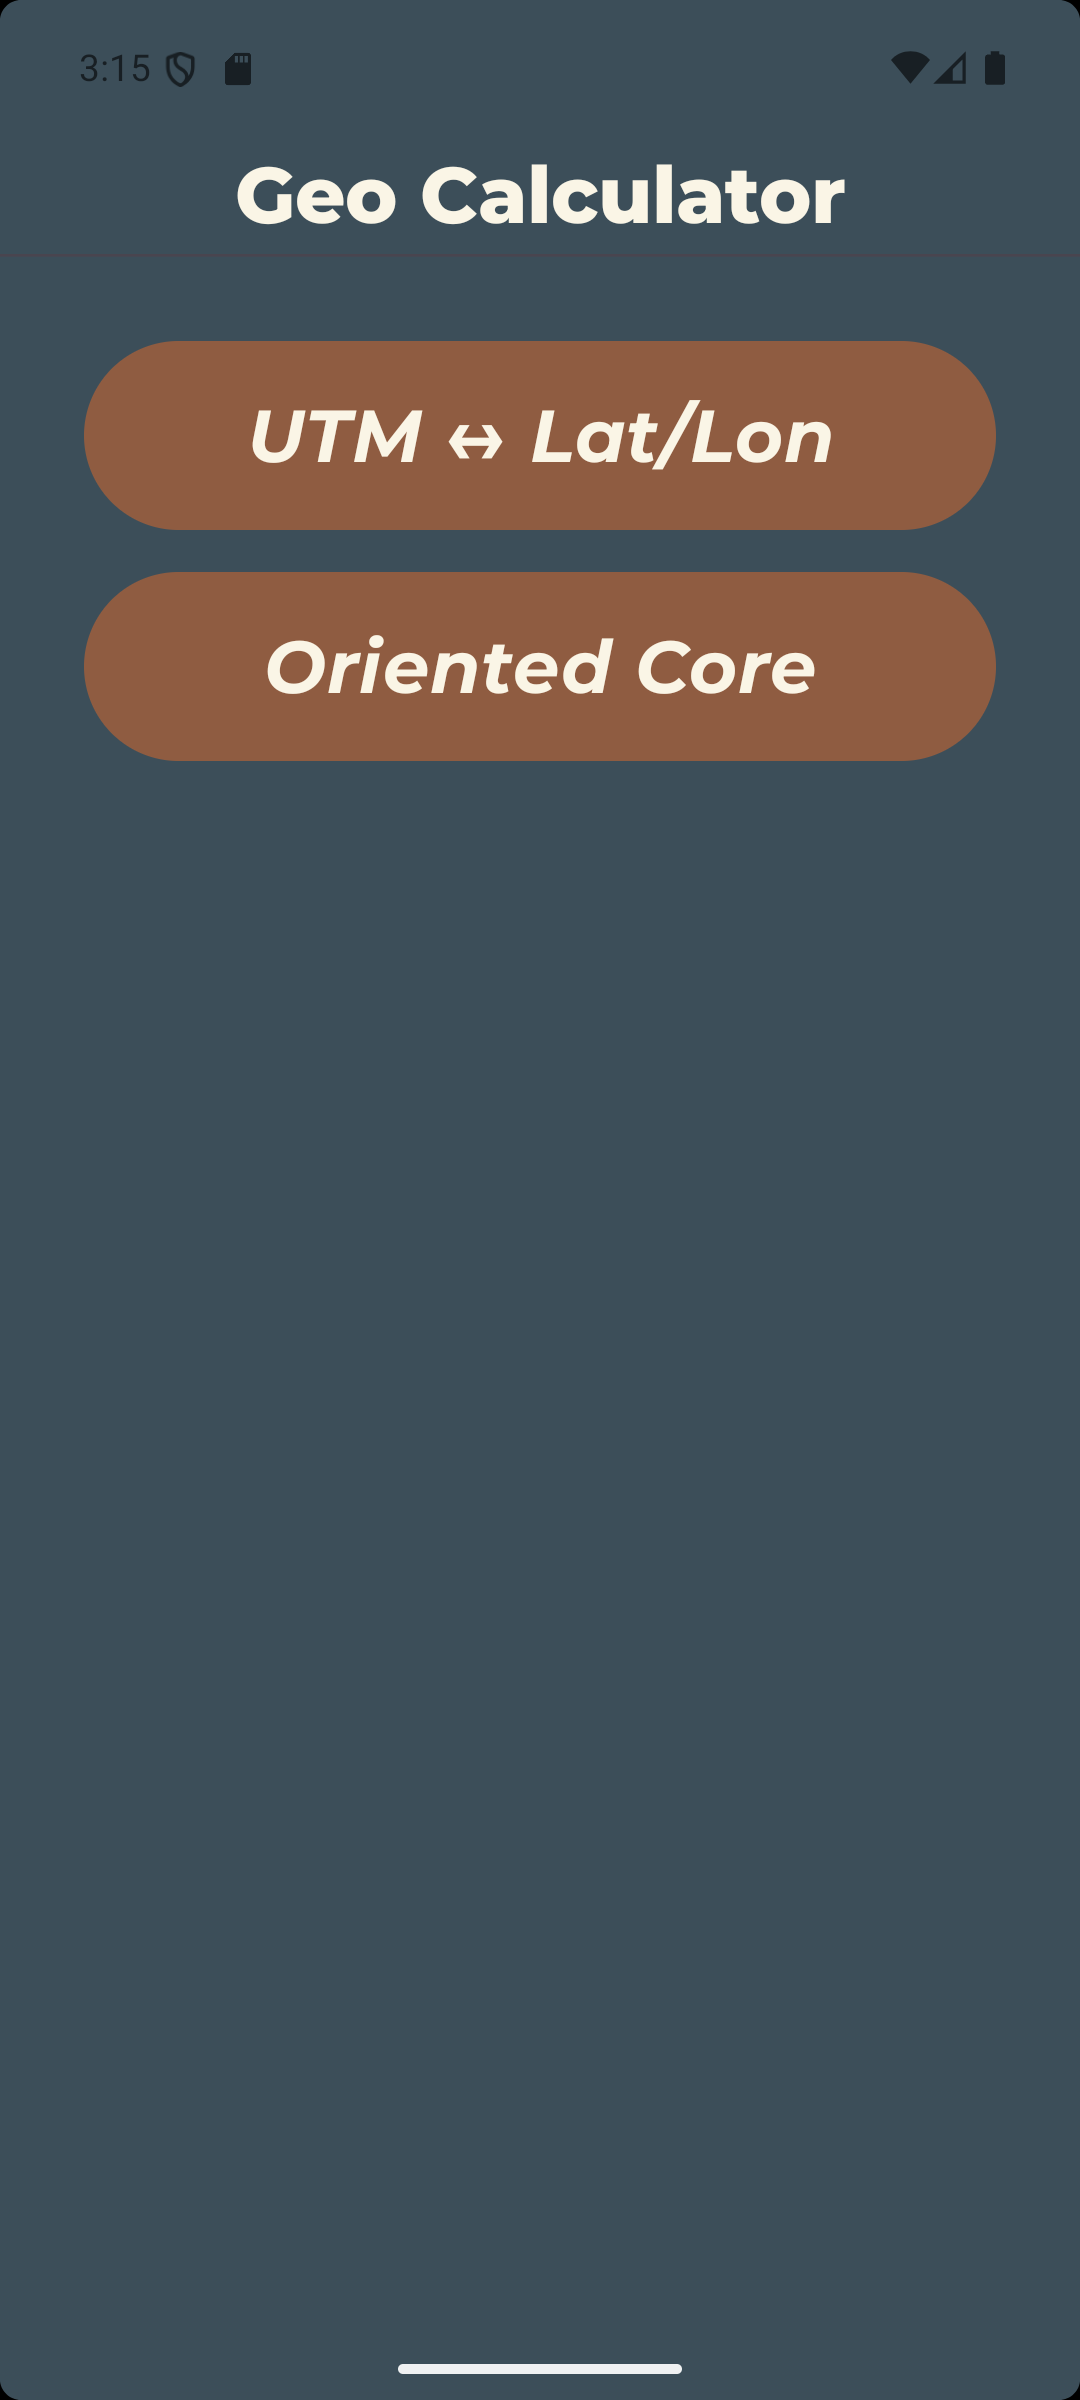
Opened from the home screen, the GeoCalculator is a set of standalone geodetic and structural tools. Unlike the Clinometer and Sample Collection tools, it does not read the device sensors or store any data — it simply takes the values you enter and returns a result. Both tools use a built-in numeric keypad that slides up when you tap a field, and read-only output fields for the results.
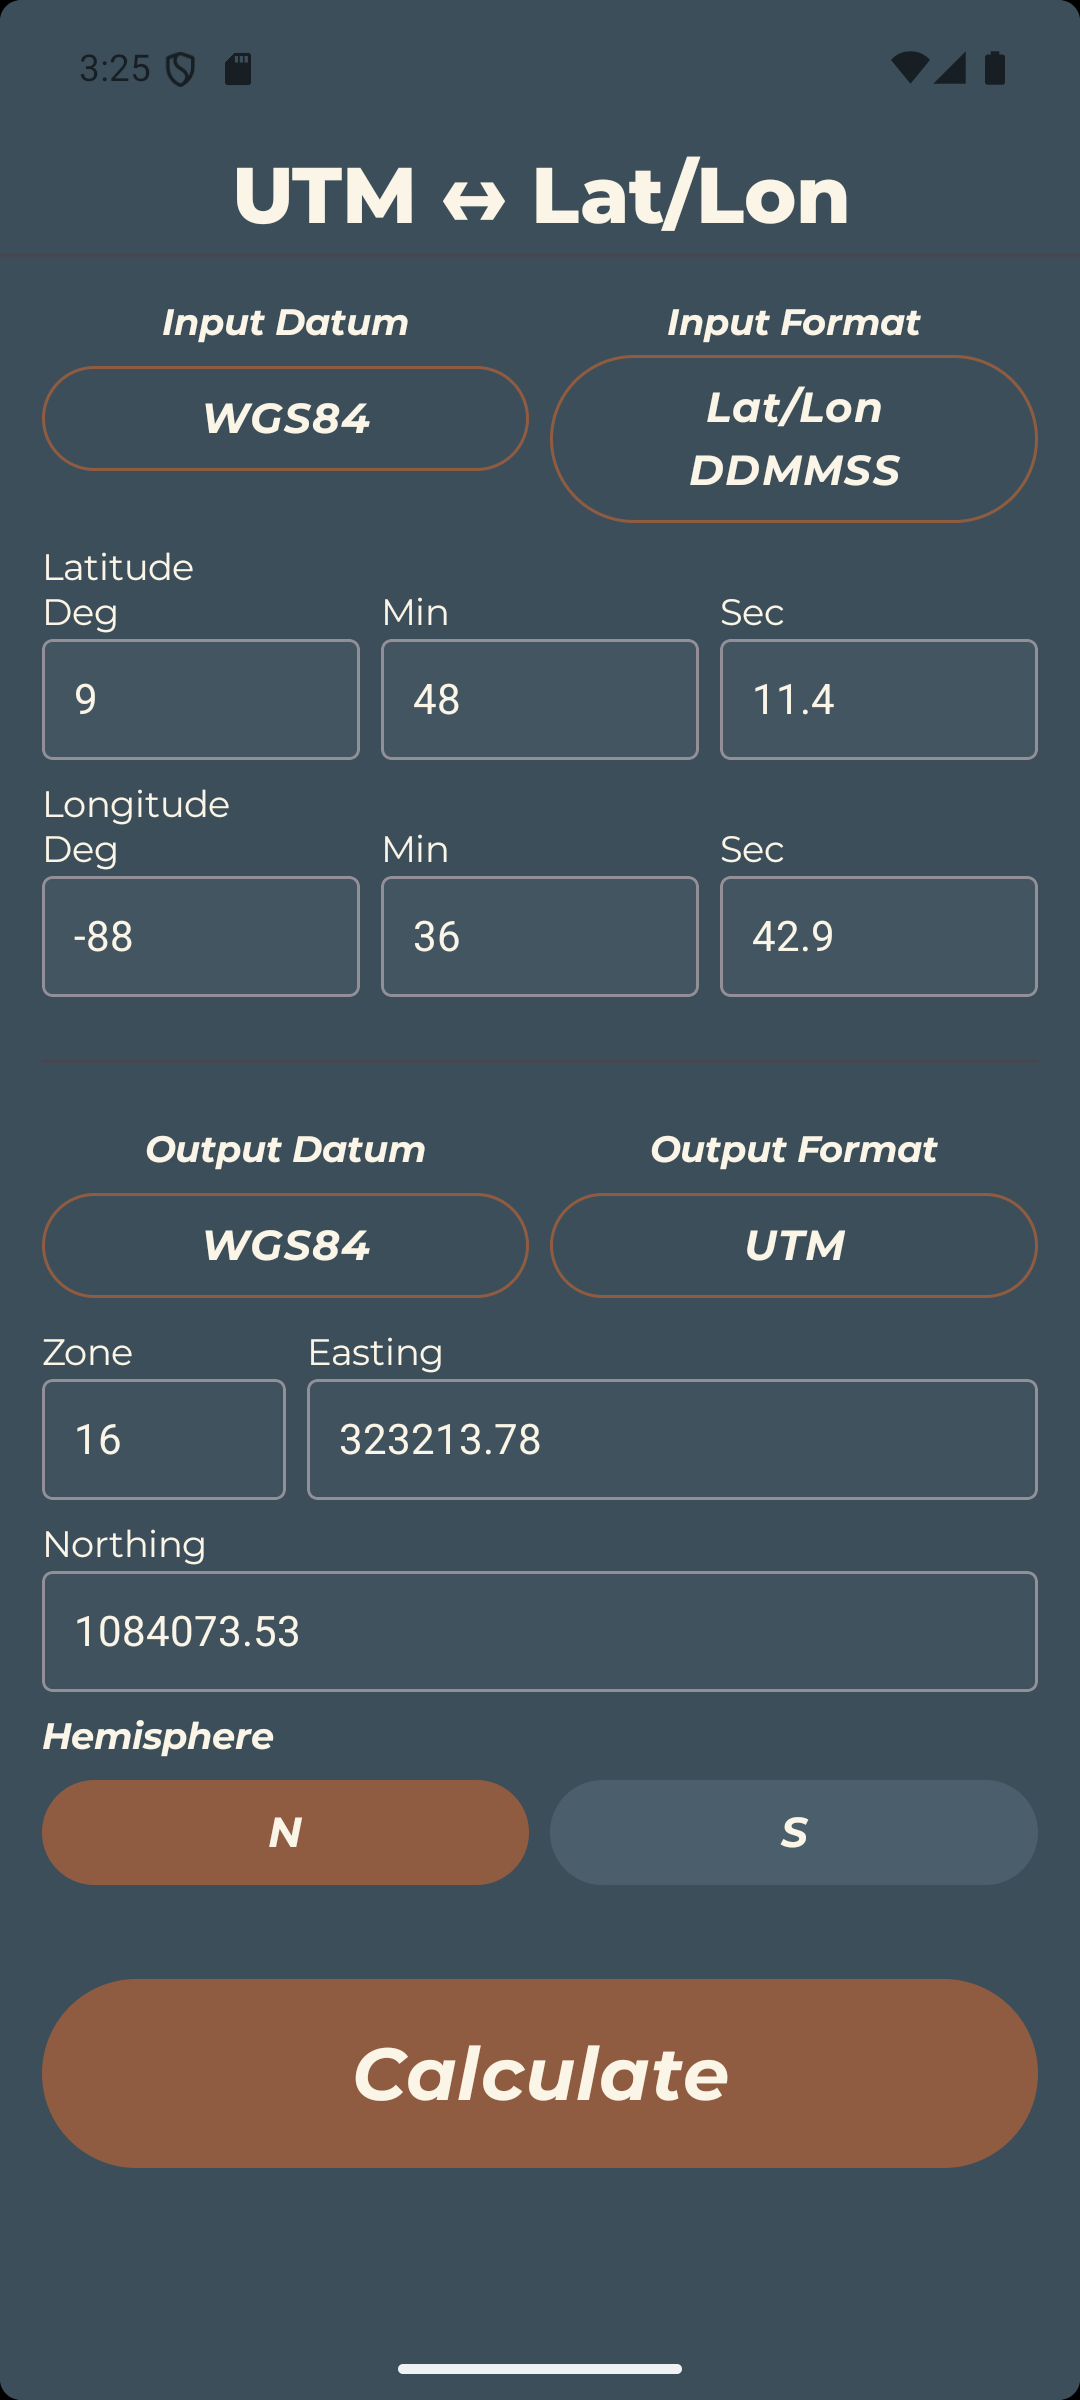
Coordinate Conversion (UTM ↔ Lat/Lon): Converts a single coordinate between formats and datums.
- Choose the Input Datum (WGS84, NAD83, or NAD27) and Input Format (Lat/Lon Decimal, Lat/Lon DDMMSS, or UTM).
- Enter the coordinate in the input fields that appear for that format. For UTM, enter zone, easting, northing, and hemisphere; for DDMMSS, enter degrees, minutes, and seconds for each of latitude and longitude.
- Choose the Output Datum and Output Format.
- Tap "Calculate". The converted coordinate appears in the read-only output fields, with datum shifts between WGS84, NAD83, and NAD27 applied automatically.
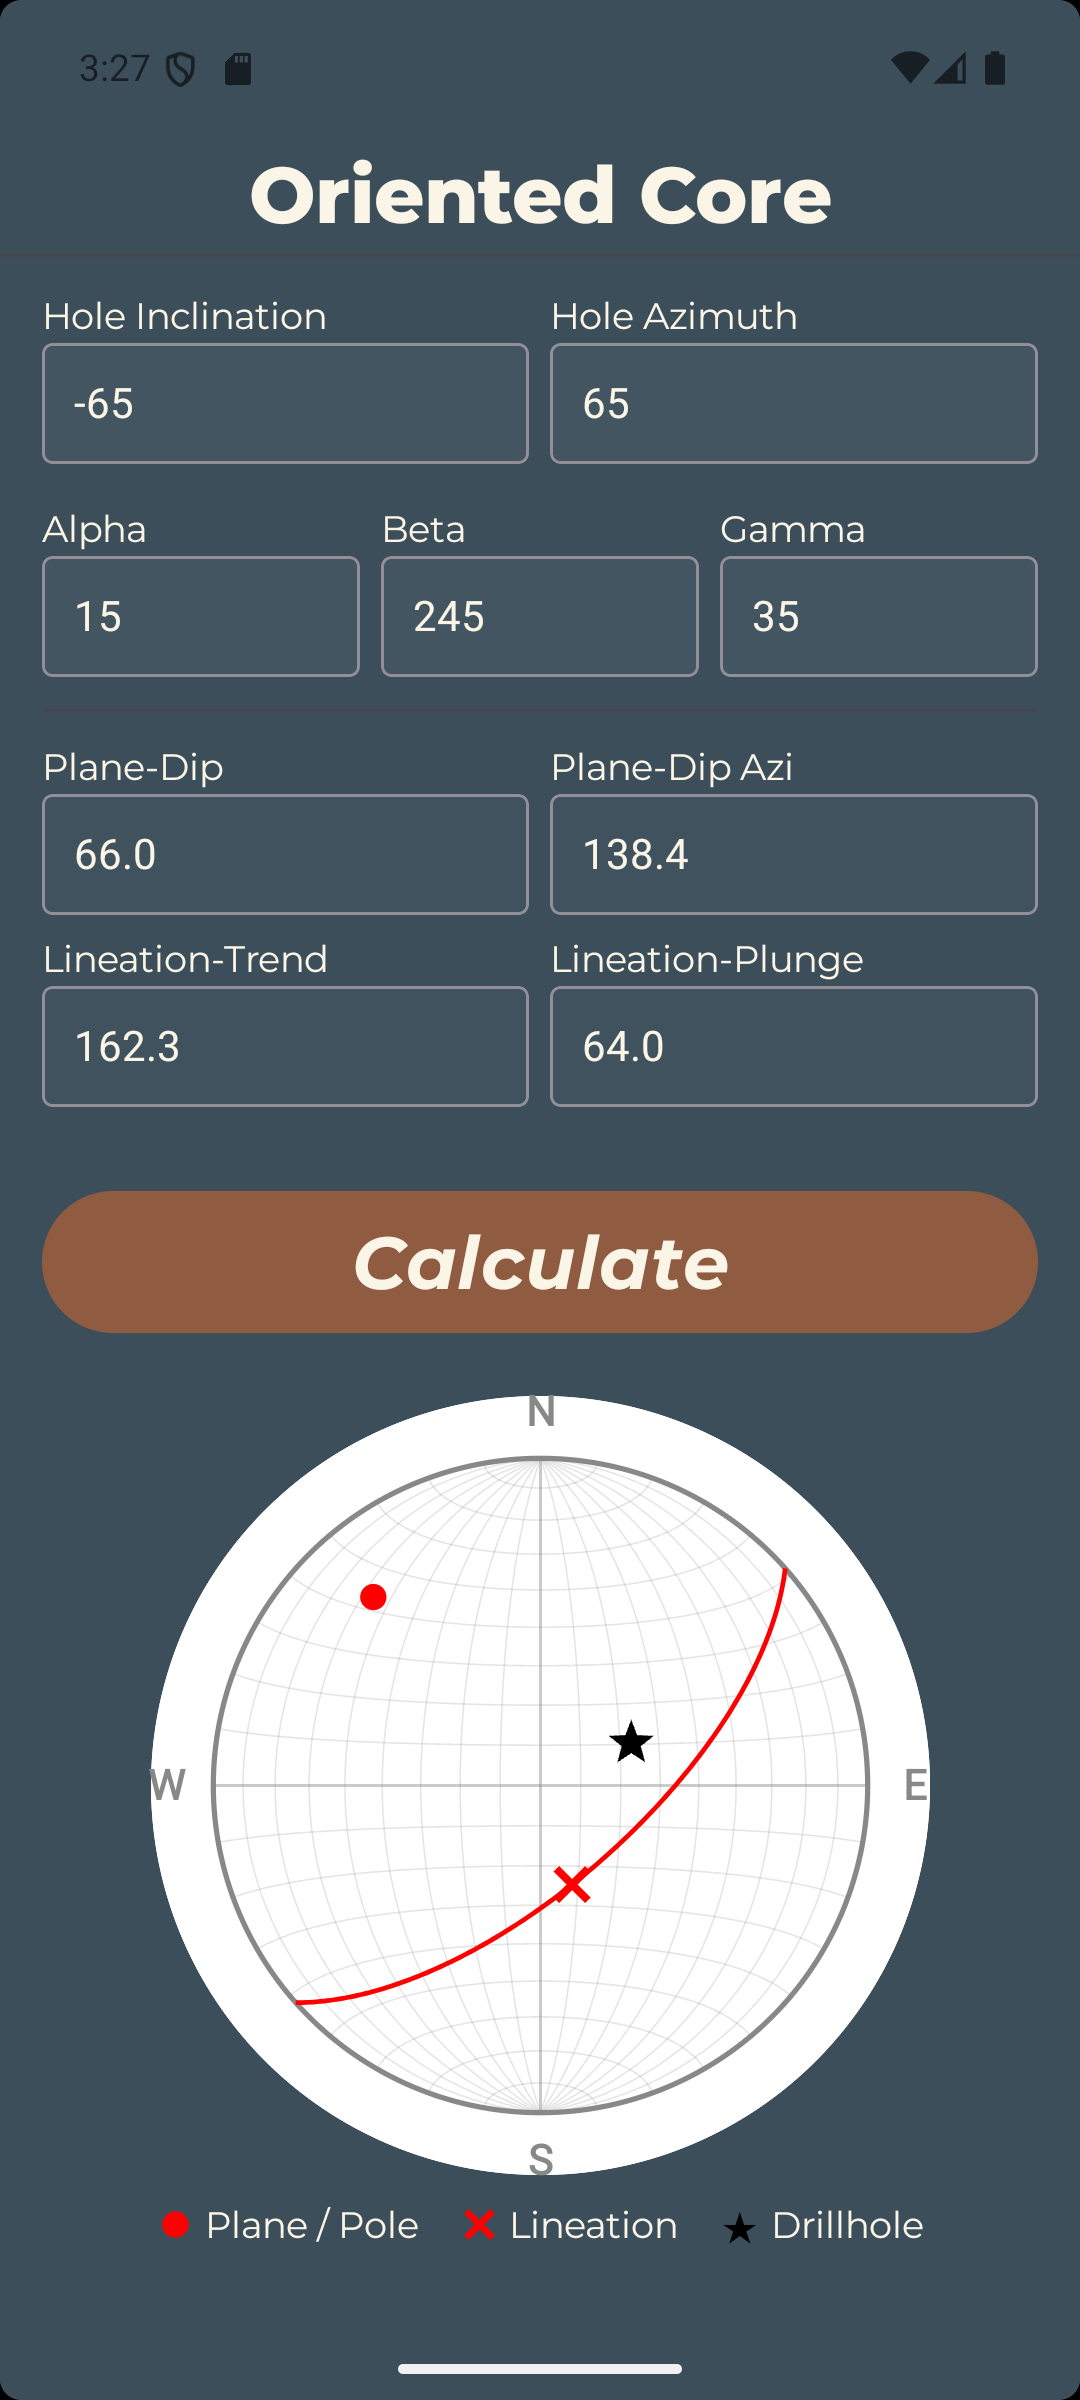
Oriented Core: Converts alpha/beta/gamma angles measured on oriented drill core into a real-world structure orientation.
- Enter the Hole Inclination (−90 to 90; negative for a downward-plunging hole) and Hole Azimuth (0 to 359).
- Enter the Alpha and Beta angles for the planar feature. Optionally enter a Gamma angle for a lineation measured on that plane.
- Tap "Calculate". The tool reports the Plane Dip and Plane Dip Azimuth (dip direction). If a Gamma angle was entered, it also reports the Lineation Trend and Lineation Plunge.
- A stereonet preview is drawn below the results, plotting the plane, the lineation (if any), and the borehole axis so you can sanity-check the geometry.
Step 8 — Export Data
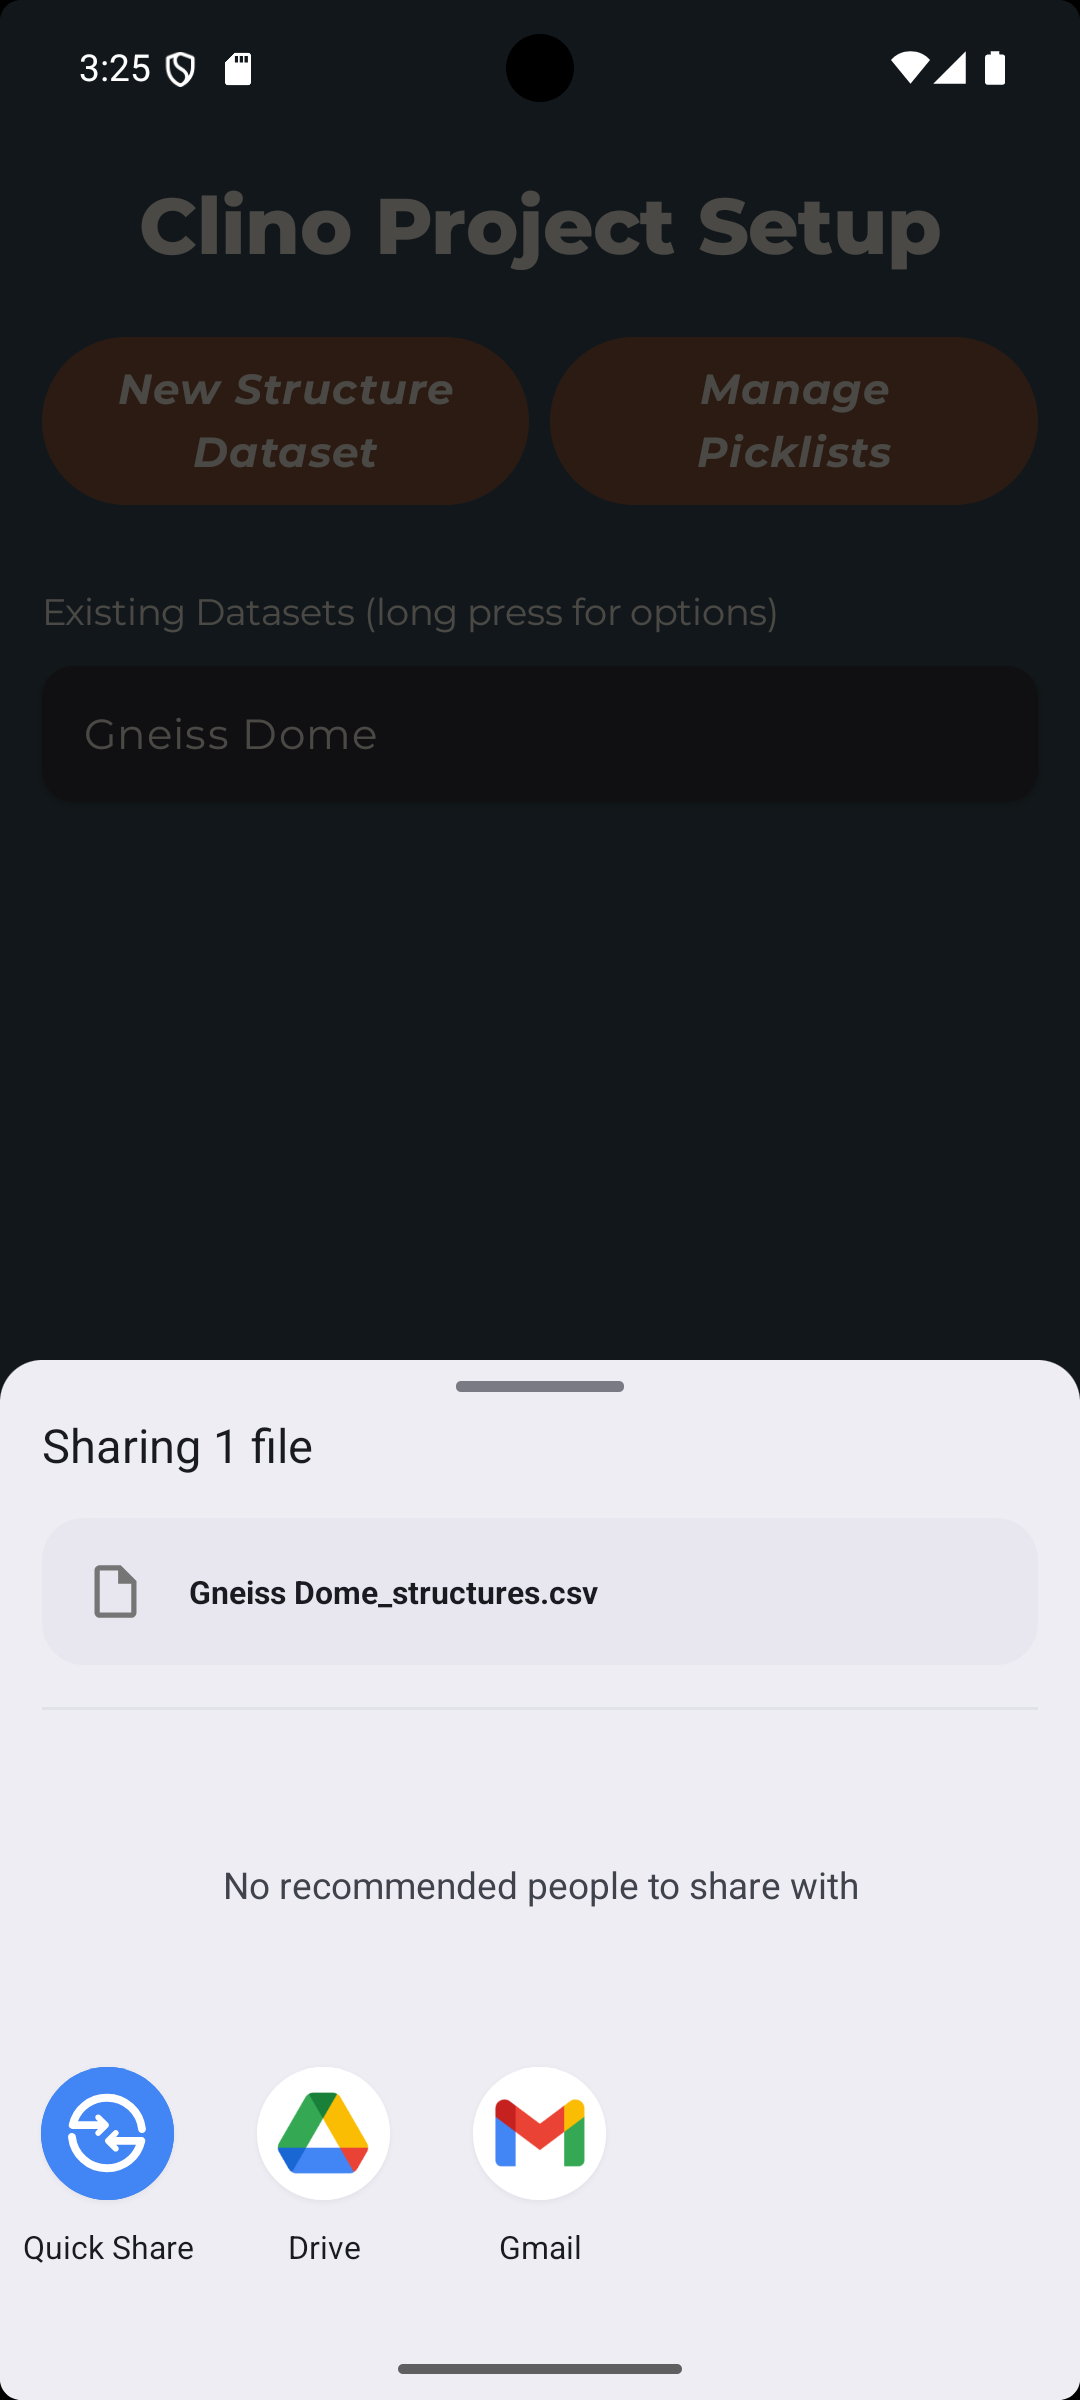
At any time, you can export your data from StrucTool by long-pressing a dataset and selecting "Export Data". This will give you the option to export your data as a CSV file or export photos as a zipped archive. Exported CSV files can be opened in spreadsheet software like Microsoft Excel or Google Sheets, or imported into data analysis software.
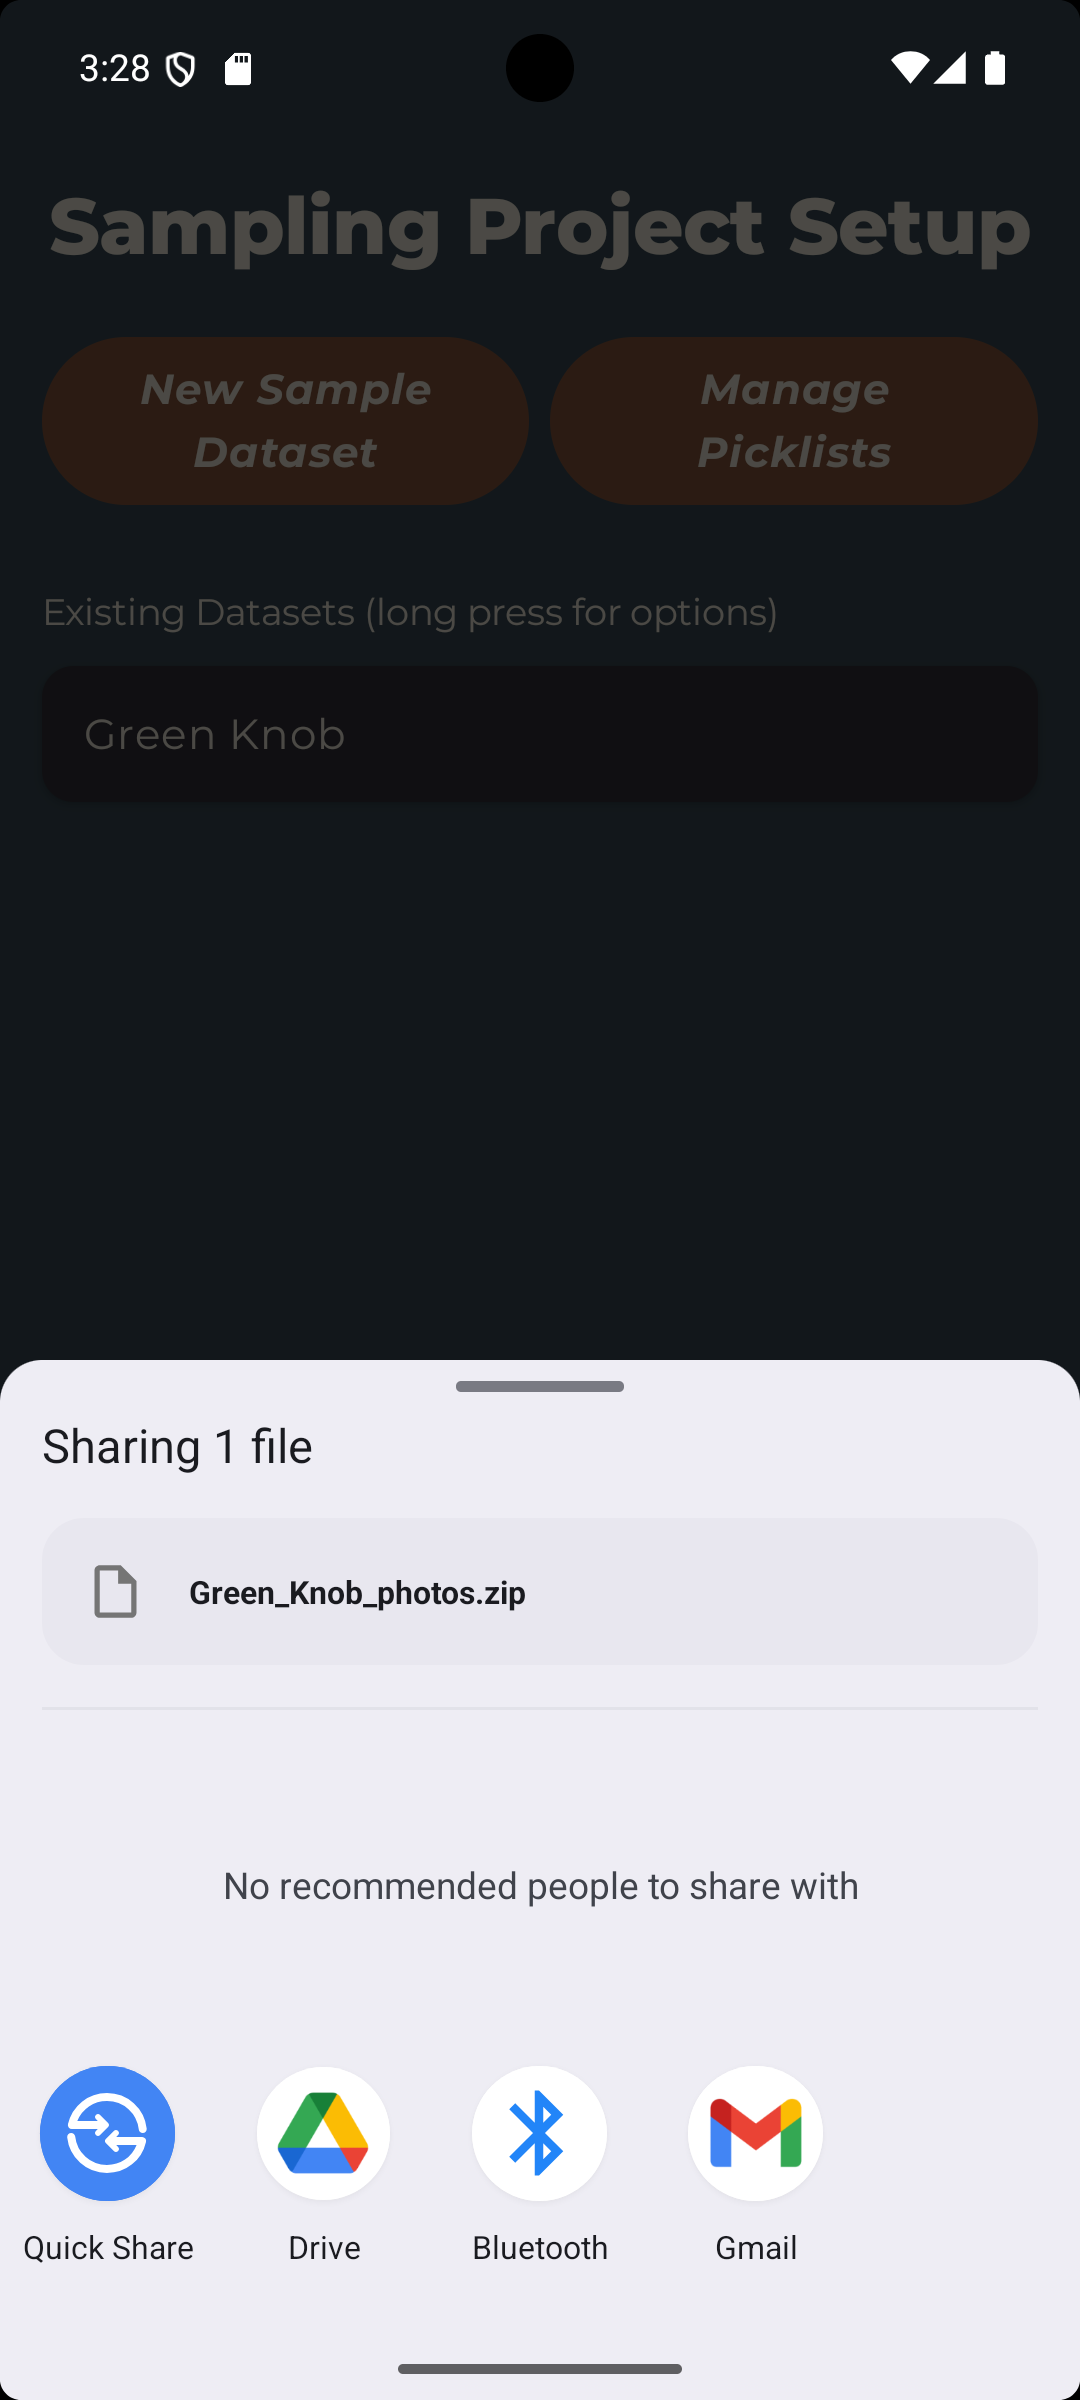
Tapping either "Export CSV" or "Export Photos" will prompt you to select an app to share the exported file with. You can choose to save the file to your device, email it to yourself, upload it to cloud storage, or share it through any other app that accepts that file type. This makes it easy to access your data off of your device and use it in other applications for further analysis or sharing with colleagues.
The files will be created with the default filenames "datasetName_structures.csv" for clinometer datasets and "datasetName_samples.csv" for sample datasets, where "datasetName" is the name you gave your dataset when you created it. Photos will be exported with the filename "datasetName_photos.zip". Sample photos inside the archive are named "datasetName_sampleID_yyMMdd-HHmm.jpg" (for example, "NorthRidge_RS-014_260714-0930.jpg"), combining the dataset name, the sample ID, and the capture date and time. Clinometer photos are named "datasetName_sequenceNumber_primaryPicklistValue.jpg" (for example, "TrailsEdge_1_Foliation.jpg"). Illegal filename characters are replaced with underscores.
Step 9 — Additional Training and Troubleshooting
Taking measurements and samples is only half the battle. This device doesn't replace good geological sense and field practices.
If you have questions about how to use the app, encounter any issues, or want to share feedback, please don't hesitate to reach out to us at support@structool.com.
Next Steps
Congratulations! You are now a proud power user of the world's most user-friendly field geology toolkit! We hope StrucTool helps you collect better data and spend less time in the field so you can get back to camp in time for supper.